

使用这 1000 个 GIS 应用程序和用途为您的数据提供超级动力
正在为您或您的学生寻找 GIS 项目而苦苦挣扎?阅读清单。
当有人问 GIS 到底能做什么时,他就麻痹了?阅读清单。
希望使您的业务和服务多样化?阅读清单。
经过一年的制作,这些是您尚未听说过的一些您最喜欢的 GIS 应用程序:
GIS 学生项目创意、GIS 案例研究、GIS 项目、GIS 用途——来自 50 多个行业,这本包含 1000 个 GIS 应用程序的拥挤指南将让您了解我们神奇的星球及其互联性。
农业

1.精准农业——使用精准农业和软件,每英亩收获更多蒲式耳,同时减少肥料支出。(如何使用 GIS 赢得农场)
2.疾病控制– 通过确定关键干预区域和有效地针对控制干预措施来对抗害虫的传播。
3.瑞士阿尔卑斯山农业——使用坡向数据在瑞士阿尔卑斯山种植朝南的斜坡,因为它可以抵御寒冷和干燥的风,这对作物的成功生长至关重要。
4.生物质 3D 扫描仪– 使用 FARO 扫描仪以激光精度测量 3D 生物质。
5.实时作物产量– 转向使用无人机和精确浇水传感器进行实时作物监测和有针对性的自动响应。
6.当前粮食安全——通过卫星、移动收集和 GIS 数据存储确定根本原因,保护粮食不安全人群。
7.农业旅游——在农业旅游的发展领域使用 GPS 接收器在农作物迷宫中导航。
8.植物抗寒性——根据气候条件定义植物能够生长的不同界限。
9.机器性能– 记录农田中农业机械的地理坐标,以更好地了解田间作业和机械性能的空间可变性成本。
10.未来的粮食需求——诊断未来的粮食需求并规划如何满足不断增长和日益富裕的人口的需求。
11.作物同化模型——模拟土壤、水和作物过程,以更好地了解作物生产力并使用 GRASS GIS 中的作物同化模型工具进行监测。
12.水资源压力——平衡当地取水量(需求)与可用水量(供应)的比率。
13.历史农业用地——绘制服务的历史和未来农业趋势。
14.饥饿地图——提高对全球饥饿和有需要的地方的认识。
15. Agromap – 按次国家行政区划分初级粮食作物,并按作物产量、收获面积和作物产量汇总。
16.作物对气候变化的适应力——通过促进农田的持续健康来适应气候变化和改变天气模式。
17.作物生产力——使用标准化差异植被指数 (NDVI) 等指标校准作物生产力,以估计全球作物生产力。(卫星图像公司 AgroWatch 绿色植被指数)
18。侵蚀生产力影响计算器 (EPIC) – 通过“与作物生产相关的土壤流失、养分流失和土壤有机碳变化的模型模拟”优先考虑农田保护计划的实施。
19.农业能力——使用加拿大土地清单对农业生产的不同潜力进行分类。
20.牧场管理——收集土壤类型、围栏线、道路和其他数据,以便更好地管理更有意义的报告和地图。
21.农业污染——量化农业污染对气候和环境的影响。
22.农业收入– 使用 IDRISI GeOSIRIS for REDD 确定与毁林和潜在农业收入相关的有效机会成本。
23.灌溉——为土地管理决策获取灌溉基础设施 世界上三分之二以上的淡水抽取用于灌溉作物。
24.农场保护——通过分析当地农业景观和构建高质量农业区的标准来建立农场优先区。
25.多功能土壤水分预算——模拟农田地区的土壤水分条件,考虑到蒸散、降雨、径流和其他因素。
26.干旱– 通过分析降雨和实时传感器(如 SMAP、SMOS 和合成孔径雷达)的空间分布,最大限度地减少干旱的影响。
27. CropScape——利用国家农业统计局的卫星图像估计作物类型的种植面积和空间分布。( USDA NASS CropScape )
28.作物预测——使用 NDVI、天气、土壤湿度、土壤类型和其他参数预测作物产量。
29.有机农业——管理有机农业许可的各种数据来源,包括耕作历史、田间投入、作物轮作和逐个田地的害虫管理措施。
30.农业非点源(AGNPS)模型
– 使用 MapWindow 31中的农业非点源污染模型预测农业对水质的影响。 Drainage Ditches – 使用 MicroImages TNTMips 中的立体图像追踪农田排水线。(TNT 立体观察工具)
32.生长期长度——当平均温度大于或等于 5°C 且降水加上土壤中储存的水分超过潜在蒸散量的一半时,可以满足作物的全部蒸散需求。
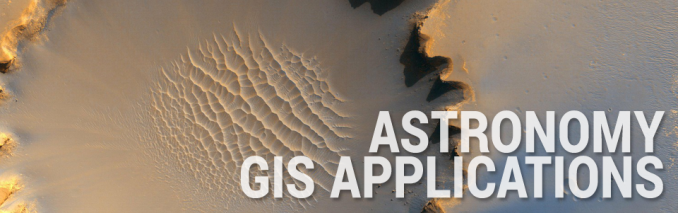
天文学
33. Asteroids – 使用 NASA 的火流星事件地图凝视天空并追踪小行星。(NASA 的 Bolide Events)
34.使用 MOLA 绘制火星地图– 开始使用 NASA 的 MOLA 绘制一个全新的星球。(USGS 行星 GIS 网络服务器 – PIGWAD)
35.火星地形– 使用火星全球测量仪 (MGS) 上的火星轨道器激光高度计 (MOLA) 仪器捕获的数据在火星崎岖的地形上旋转。(火星地形)
36.火星探测器着陆– 检查如何使用包括太阳能纬度、土壤柔软度、使用激光测高仪的坡度、灰尘、岩石和着陆足迹在内的操作标准安全着陆火星探测器。
37.火星上的水流– 对火星数字高程模型进行山体阴影处理,以增强易读性并了解河流可能流过的地方和海洋的繁荣之处。(火星水流)
38.卫星轨道——凝视天空寻找卫星,甚至对卫星进行编程以获取图像。(卫星地图)
39.磁场– 使用国际地磁场图以 3D 方式研究磁场线。
40.天体地质学– 在公共领域向国际科学界提供行星测绘——从行星拓扑到月球地质。(Astrogeology Science Centre)
41. UFO Sightings – 使用比例符号推测 UFO 目击事件,可追溯到 1905 年的 90,000 多份报告。
42. Light Pollution – 识别人类在夜空中引入的人造光以及它如何干扰对星星的观察. (NOAA 的 VIIRS 数据)/光污染地图)
43. Google 地球中的火星 – 使用 Google 地球的“火星直播”图层搜索火星地标。
44.国际空间站– 在 ArcGIS Online 数据中跟踪国际空间站 (ISS) 的实时位置。
45.金星– 绘制金星的测高、阴影地形和地质图。
46.磁偏角– 使用 NOAA 国家地球物理数据中心 2015 年数据和磁偏角 QGIS 插件进行磁偏角定位,从真正的地理北方变化角度。
47. Gravity Anomaly – 通过绘制地球不同区域不寻常的质量浓度图来了解我们地球的重力。(大地水准面)
48. NASA Visible Earth – 对来自各种传感器的电磁频谱中我们家园星球的图像和动画进行编目。(NASA Visible Earth )
49.第谷– 测绘第谷,最年轻的月球陨石坑。
50. Milky Way – 用 GLIMPSE(Galactic Legacy Infrared Midplane Extraordinaire)测量银河系内部
考古学

51. Lost Cities – Revealing lost cities in the ground by using ground-penetrating radar and infrared sensors. (LiDAR uncovers lost cities)
52. Archaeological Survey – Tackling huge problems archaeologists face every day – collecting physical locations of their excavation findings from a wealth of sites.
53. Middle Eastern Geodatabase for Antiquities – Recording, monitoring, and protecting archaeological sites to avoid impacting, factor cost for site mitigation – developed by the Getty Conservation Institute (GCI) and the World Monuments Fund (WMF). (MEGA Geodatabase)
54. Geographic Text Analysis – Incorporating a semi-automated exploration of written texts combining Natural Language Processing techniques, Corpus Linguistics and GIS.
55. QGIS Archaeology Tools – Computerizing the archaeological community with their record-keeping with the pyArchInit QGIS plugin.
56. Mediterranean Landscape Dynamics – Modeling surface process change and landscape evolution to better understand the long-term interactions of humans and landscapes in the Mediterranean using GRASS GIS.
57. Preliminary Site Investigation – Searching ancient maps for buildings, cemeteries, roads, and fences as these sites present important clues to archaeological sites.
58. Stone Tools – Characterizing geographic features suitable for making stone tools and clay pottery such as lithic materials, water resources, stream hydrology with geologic controls like bedrock outcrops and drainage basin floodplains.
59. Viewshed – Scoping out a site by determining what is within eyesight considering all prehistoric conditions associated with that viewshed.
60. Archaeological Site Prediction – Connecting favorable slope, aspect, geology, hydrology, and distance to water using the Multiple Criteria Evaluation (MCE) to predict archaeological sites.
61. Cultural Heritage Inventory – Customizing and deploying the collection of cultural heritage field observations with open source geospatial software Arches. (Arches Heritage Inventory & Management System )
62. 3D Archeology – 提供考古遗址的准确和高效的 3D 记录,特别是带有航空影像和 3D 环境的考古发掘。
63. Shovel Test Pits – 当他们访问潜在位置进行实地调查时,记录样带、铲测试坑和其他记录。
64. Predicting Dinosaur Tracks – 深入了解恐龙曾经在地球上漫游的确切位置,包括植被覆盖、坡度、坡向和滑坡附近。
建筑学

65.视线– 规划高层建筑,使它们不会使用视线工具阻碍波特兰山脉的视野。(3D 分析工具)
66.噪音暴露——使用 OrbisGIS 制定城市交通计划,特别考虑环境噪音的影响。(城市噪音)
67.发展规划——通过明智的发展规划和了解大局,让市民快乐。
68.人群模拟——以接近“实时”的时间尺度,在单个家庭、人和房地产单位的尺度上掌握城市现象中相互作用对象的集体动态。(人群模拟)
69.日光照射– 使用 3D 城市模型和几何信息(例如屋顶的倾斜度、方向和面积)收集光以评估在屋顶上安装太阳能(光伏)板的适用性。
70. City Engine – 使用 Esri 的 City Engine 评估可行性和计划实施,改进城市规划、建筑和整体设计。
71.行人行为——在哥本哈根的一个广场上辨别行人的运动和城市行为。
72.阴影分析——使用 Bentley Map 诊断在施工前阶段投射到其周围环境的阴影量。
73.停车位可用性– 通过收集占用空间与搜索时间的百分比来安排可用的停车位。
74. GIS 和 BIM 的集成——使用 BIM(建筑信息模型)运营设施,因为它能够分析信息并整合来自不同系统的数据。(室内制图)
75.有形景观——使用易于使用的 3D 草图工具试验不同建筑配置的潜在影响。(有形景观)
76.地理设计——将建筑计划概念化,重点关注利益相关者的参与和合作,以密切关注自然系统。(地理设计)
77.城市环境中噪音的传播——对 3D 数据进行建模,以回答城市居民如何受到噪音污染的伤害,以及如何通过隔音屏障来减轻噪音。
78.空间利用——通过将优化算法应用于空间利用来增强 NASA 的兰利研究中心。(空间利用)
79. Ordnance Survey Geovation – 通过 Geovation 在英国开创性的位置创新 – 协作、思想交流和激发创新。(军械测量地理定位)
北极/南极洲
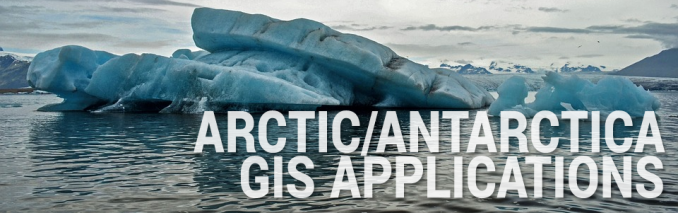
80. Quantarctica – Familiarizing yourself with the Antarctic with the free, open-source source collection of geographical datasets.
81. Exclusive Economic Zones – Carving out boundaries in the Arctic – Canada, Norway, Russia, Denmark (via Greenland), and the United States are limited to their economic adjacent to their coasts while all waters beyond are considered international water.
82. Shipping Route Shortcuts – Transporting goods through the Arctic passage because of melting ice in the North Pole.
83. Sea Ice Motion – Maintaining an inventory of sea ice extents snapshots from NOAA’s National Snow and Ice Data Center. (Sea Ice Motion)
84. Aspect – Using aspect and incoming solar radiation data to understand how glaciers accumulate on the poleward side.
85. Subglacial Lakes – Mapping lakes under glaciers – isolated from the outside world for up to 35 million years, and may be final refuges for life, the like of which exists nowhere else on Earth. (Subglacial Lakes)
86. Antarctic Digital Magnetic Anomaly Project (ADMAP) – Uncovering the tectonic evolution using near-surface magnetic anomaly data. (Antarctic Magnetic Anomaly)
87. Wildlife Tracking – Logging the species richness of marine mammals like whales, seals, walruses and narwhals, and seabirds or waterfowl in the Arctic.
88. Sea Ice Index – Bringing together data on Antarctica’s ice sheet surface, thickness, and boundary using passive remote sensing. (Sea NSIDC Ice Index)
89. Fish – Showing the probability of occurrence and observations for fish species – from Atlantic cod to Walleye Pollock. (Commission for the Conservation of Antarctic Marine Living Resources)
90. Arctic Research Projects – Displaying research projects, showing available data, and exploring possible collaborations. (Arctic Research Projects)
91. Arctic Ocean Floor – Sculpting the Arctic Ocean with the sonic depth finder and discovering dynamics with trenches, ridges, and abyssal plains.
92. Arctic’s Geology – Interpreting the geology of the Arctic using enhanced magnetic data, Landsat imagery, and topographic data. (Arctic Geology)
93. COMNAP Facilities – Mapping out the COMNAP facilities in Antarctica that currently supports a range of scientific research. (COMNAP Facilities)
94. Polar Bear – Keeping counts of the most vulnerable populations of polar bears (due to climate change) by comparing two satellite images over time.
95. Search and Rescue – Lunging into search and rescue operations using the Safety and Operability Index which calculates risk based on factors such as sea ice, visibility, temperature, and distance from SAR resources.
96. Environmental Risk – Assessing the environmental vulnerability of marine resources with respect to oil spills as external stressors. (Arctic Environmental Risk)
97. Polar Ice Melt – Monitoring the polar ice melt using satellites like GOCE and GRACE that measures how much mass is on Earth. (GOCE and GRACE Satellites)
Aquatics
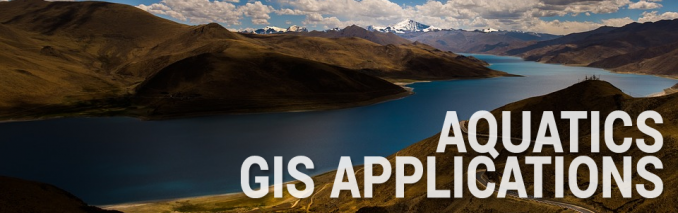
98. Stream Order – Defining stream size based on a hierarchy of tributaries the Strahler Index (or Horton-Strahler Index) – an important indicator of fisheries and aquatic habitat.
99. Fish Habitat Models – Connecting fish species with their habitat using habitat suitability indexes.
100. Whale Tracking – Stalking pigmy killer, sperm, beaked and false killer whales in the Pacific Ocean with online mapping applications.
101. Global Shark Tracker – Monitoring shark recovery rates with acoustic tags allowing detection in multiple dimensions. (OCEARCH)
102. Fish Eradication – Eradicating Northern pike which negatively affects local trout fishery and the economy by tracking their movements with GPS.
103. Spawning Sites – Drawing spawning site boundaries for migratory fish that are known to release eggs.
104. Hydro-Acoustics – Listening to echoes with hydro-acoustics for the Crean Lake Hydro-Acoustics project – capturing lake depth, fish class, fish stock numbers, and habitat preference related to temperature. (Crean Lake Hydro-Acoustics)
105. Mercury in Stream – Grasping the origin of mercury – which are contaminants to fish tissue – by studying the landscape such as soils and humus.
106. Fish Habitat Conservation Areas – Fine-tuning fish habitat conservation areas by knowing the big picture of fish distribution.
107. Overfishing – Maintaining sustainable fish population levels with satellite monitoring of sea surface temperature and ocean colors (because they are indicative of specific fish species).
108. Stress Monitoring – Correlating fish stresses from the local environment such as heat stress from the removal of trees along a stream.
109. SCIMAP – Identifying locations of diffuse pollution risk for polluted water and aquatic habitat using SCIMAP. (Diffuse Pollution Risk Mapping)
Aviation

110. Live Air Traffic – Turning your computer into an air traffic control center using Flight Radar 24. (Flight Radar 24)
111. Airplane Identification – Pointing your phone to the sky and identifying airplanes above you using Flight Radar 24.
112. World’s Busiest Airports – Surfing the world’s top 25 busiest airports with the Esri Global Crossroads Story Map. (World’s Busiest Airports)
113. Voronoi Diagram – Discovering that Mataveri Airport in Easter Island is the most remote airport in the world with the Voronoi airport proximity map. (Voronoi Diagram)
114. Obstruction Evaluation – Securing safe take-offs and landings with the Federal Aviation Agency’s (FAA) vertical obstruction database
115. Flight Path – Simulating flight paths integrated with elevation data, imagery, and other spatial data using Falcon View.
116. Search for Flight MH370 – Crowd-sourcing the search for flight MH370 with satellite imagery provided by DigitalGlobe.
117. Airspace Builder – Visualizing the air available to aircraft to fly in with 3D volumes using NASA’s World Wind. (NASA World Wind)
118. Air Traffic Control – Fine-tuning air traffic control with a common operational picture for security vulnerability and land use permitting.
119. Drone No-fly Zones – Delineating drone no-fly zones where it’s illegal to fly such as near airports and military bases.
120. Aeronautical Charts – Scouting out the best routes, safe altitudes, and navigation aids in the sky with aeronautical charts.
121. Runway Approach Zone Encroachment – Pinpointing obstructions in the approach zone of a runway using detailed elevation data to ensure no collisions FAA Safety Analysis.
122. Airport Sound Exposure – Assessing the relationship between aircraft-generated noise levels and land uses, noise receptors, and demographics in the airport environs.
123. Fly Through – Cruising the high altitudes with interactive 3D viewing and fly-throughs with Landserf. (Landserf)
124. Flight Simulator – Becoming a pilot in the cockpit with three-dimensional perspective views of an area by combined with elevation and imagery. (Online Flight Simulator)
125. Air Space Review – Automating the dissemination and portrayal of Special Activity Airspace information via OGC Web Services. (Envitia Special Air Space)
Automobile

126. Toyota Vehicle Crowd Sourcing – Piecing together hyper-precise and up-to-date maps using the Toyota vehicle’s GPS and camera.
127. In-Vehicle Usage – Monitoring driving habits like speed, sudden acceleration, and pushing hard on the brakes for insurance underwriting.
128. GeoFencing – Immobilizing cross-border travel with geofencing (virtual barriers) – perfect for car sharing and rental programs. (To Geofence or not)
129. Self-Driving Vehicles – Sitting back and relaxing while Google’s autonomous car does all the work equipped with LiDAR, GPS, an inertial unit, and sophisticated software. (Google’s Self-Driving Car)
130. GPS Receivers – Nurturing mapping technology as it’s almost standard to have a GPS receiver and a monitor with all the latest maps.
131. Waze Real-Time Driving – Saving time and money on your commute as drivers share real-time traffic information and road alerts with each other with Waze. (Waze Live Map)
132. Estimated Travel Time – Locking in your destination and getting live updates for estimated travel time.
133. Morgan Freeman’s Voice – Enjoying the calm, soothing voice of Morgan Freeman as he delivers directions from your GPS navigation system. (Morgan Freeman GPS)
Banking

134. Market Share – Examining branch locations, competitor locations, and demographic characteristics to identify areas worthy of expansion or determine market share.
135. ATM Machine – Filling in market and service gaps by understanding where customers, facilities, and competitors are with address locating, database management, and query tools.
136. World Bank Economic Statistics – Slicing and dicing raw financial data from the World Bank. (World Bank Data)
137. Merger and Acquisitions – Profiling and finding opportunities to gain and build where customers are with market profiling
138. Supply and Demand – Identifying under-served areas and analyzing your competitor’s market.
139. Community Reinvestment Act (CRA) – Fulfilling the obligations to loan in areas with particular attention to low- and moderate-income households – using GIS to understand spatial demographics.
140. Mobile Banking – Capturing locations where existing mobile transactions occur and assisting in mobile security infrastructure.
Business

141. Fleet Management – Staying in route and solving scheduling problems with fleet management. (Network Analysis)
142. Augmented Reality – Augmenting reality with commercial use in mind – such as advertising and restaurant reviews. (Google Glass)
143. Direct Marketing – Revitalizing selling strategies by reaching out to customers directly with locational intelligence.
144. Drive-Time Analysis – Determining a trade area based on how long a customer must drive to get to the store – factoring in street speed limits, traffic volumes, and other impedance.
145. Internet of Things – Improving efficiency, accuracy, and economic benefit through a network of physical objects such as devices, vehicles, buildings, and other items—embedded with electronics, software, sensors, and network connectivity that enables these objects to collect and exchange information with one another. (Internet of Things)
146. Market Share Analysis – Optimizing the locations of facilities so the allocated demand is maximized in the presence of competitors using tools like location-allocation in ArcGIS. (Location-Allocation Tool)
147. Nearest Location – Resolving the nearest gas station, restaurant, or coffee shop using GPS-based positioning and geocoded business data.
148. Property Appraisal – Appraising residential properties using Census data and finding your property online through interactive property assessment viewers.
149. Internet Geocoding – Mapping and analyzing user-generated geocoded data to get a glimpse of what internet users (in the aggregate) think about particular places. (Geocoding)
150. Geocoding Businesses – Pinpointing anything to everything from restaurants, banks, and donut shops with a list of addresses.
151. Reverse Geocoding – Geocoding in reverse; taking locations from a map and listing their addresses.
152. Daytime Population – Marketing products effectively with detailed daytime population demographics for an area reflecting who works in that area as opposed to residential demographics.
153. Local Advertising – Advertising through social, local, and mobile mediums through location and making presence more known.
154. Tax Havens – Sheltering tax through tax havens then putting it all on a map. (Open Corporates)
155. GeoBranding – Increasing credibility and increasing sales with prospective clients, vendors, and media by conveying complex data to increase sales.
156. Desire Lines – Plotting desire lines showing stores that serve customers. (Origin and Destination – QGIS Oursins Plugin)
157. Commercial Establishments – Updating commercial establishment using gvSIG Mobile and local databases. (Commercial Establishment Database)
158. Supply Chain – Finding which supply chains are vulnerable to better plan for interruptions (Boundless Supply Chain)
159. Integrated Freight Network Model – Integrating highly detailed information about shipping costs, transfer costs, traffic volumes, and network interconnectivity properties in a GIS-based platform. (Integrated Freight Network Model)
160. Capital Projects – Listing all the capital projects with different stages of completion.
161. Gravity Models– 根据商店的距离、竞争和其他因素确定顾客光顾特定商店的可能性。
162. Employee Travel Times – 为员工出行时间建模城市网络中的出行时间。
163.开店——历史化公司开店。(宜家开店)
164. Foursquare – 推荐 5000 万用户使用 Mapbox 定制品牌地图在世界各地搜索餐厅、推荐酒吧和签到。(Foursquare)
165.基础设施扩展——将历史数据与当前状况与 Astro Digital 的卫星数据进行比较。
消费者行为

166.数据分析——分析基于位置的信息,以揭示个人、家庭和社区之间的关系,以及他们所居住的环境。
167. Huff 模型——基于 Huff 模型计算销售潜力——一种交互模型,测量每个原产地消费者光顾新商店而不是其他商店的概率。(Huff Gravity 模型)
168.消费者画像——利用基于位置的年龄、种族、教育、住房等信息优化消费者画像。( GeoEnrichment )
169.零售客户细分– 按客户原型细分市场,以提高活动的有效性。(Esri Tapestry 细分)
170.购买行为– 将天气和位置等不可想象的变量与购买行为相关联,以寻找销售机会。
171.零售店运动——详细说明客户如何在零售店中移动,他们购买、拒绝和查看的内容。
172.实时天然气价格——在路线上或沿线的各个加油站众包天然气价格更新。(Waze 众包天然气价格)
173.商店布局– 通过研究可支配收入、人口或其他变量来指导新商店的布局,以最好地为人口服务。
气候变化

174. NASA Earth Observatory – Exploring the causes and effects of climate change on our atmosphere, oceans, land, and life through the use of satellite data. (NASA Earth Observatory)
175. Climate Change Skeptics – Turning skeptics into believers. Maps make climate change findings easier for skeptics to understand and accept. (Climate Viewer)
176. Earth Interactions – Modelling vegetation, atmospheric, rainfall, and ecosystems to study their interactions simultaneously
177. Sea Level Rise – Collecting data to study sea level rise and climate change from the Jason-3 satellite. (Climate Central)
178. County Climate – See for yourself how the average maximum temperature rises/falls in each county in the United States. (County Climate)
179. Desertification – Understanding the underlying causes of desertification such as inappropriate agriculture practices, deforestation, and drought.
180. Land Surface Temperature Change – Using map algebra to see how land surface temperature changes year by year. (Land Surface Temperature)
181. Piecing Together the Climate Change Puzzle – Combining various climate change data sets from various sources – for example relating land practices with atmospheric aerosols. (ArcGIS Online)
182. Pollution Modelling – Mapping air pollution sources and impacts on the environment and people.
183. Google Planetary Engine – Seeing with your own two eyes the alarming changes on our planet. (Google Planetary Engine)
184. Bird Risk and Richness – Studying the effects of shrinking habitats on bird populations in the world. (Audubon)
185. Carbon Sequestration – Deferring global warming through carbon sequestration through location-based carbon management systems.
186. Köppen-Geiger Climate Classification – Modelling observed and projected climate change scenarios with variables such as population growth, economic development, and varying energy use and technological innovations.
187. Smog – Squinting your eyes to see through all of that smog.
188. Temperature Change – Measuring the effects of greenhouse gases as the main culprit of temperature change by mapping temperature at levels above the Earth’s surface.
189. Climate Change Design – Redesigning to accommodate climate change and pinpointing those locations needed most.
190. Land Change Modeller – Simplifying innovative land planning and decision support with IDRISI’s Land Change Modeler. It includes special tools for the assessment of REDD (Reducing Emissions from Deforestation and forest Degradation) climate change mitigation strategies.
191. Vegetation Indices – Using remote sensing vegetation indices like NDVI, CTVI, NRVI, and PVI to monitor vegetation change throughout time.
Crime

192. Crime Patterns – Responding to crimes with a data-driven approach and delivering tailored responses through rapid deployment of personnel and resources. (Spillman CompStat)
193. Incident Map – Keeping the community safer by streaming visual mediums for arson, assault, burglary, homicide, prostitution, robbery, theft, and vandalism in a city.
194. Auto Theft and Recovery – Tracking auto theft with GPS-enabled vehicles.
195. Sex Offenders – Tracking past criminal offenders with GPS movement patterns in relationship to schools and other entities.
196. Emergency Calls and Dispatch – An emergency call starts and ends at a location. GIS can manage both 911 calls and dispatching units to precise locations. (Zetron Computer-Aided Dispatch)
197. Law Enforcement Operations – Allocating and dispatching police officers where it’s needed most by studying crime activities.
198. Unlawful Landlords – Capturing thermal signatures of illegal tenants in sheds because renting out sheds is illegal in London, England.
199. Predictive Policing – Patrolling Mapping clusters of burglaries or other crimes assigning more police in those locations using heat maps or Getis-Ord General G and point patterns.
200. Missing Body Search – Narrowing down the search for a missing by finding subtle terrain anomalies in the ground using LiDAR.
201. Megan’s Law – Obeying the requirement for local law enforcement agencies to notify residents about the presence of certain sex offenders in their area by only contacting a buffered area of the offender’s residence.
202. Forensic GIS – Applying science and geographic information for the investigating of a crime – such as using GPS-recorded information in vehicles to prove the location at the scene of a crime. (Forensic GIS – The Role of Geospatial Technologies for Investigating Crime and Providing Evidence)
203. GeoEvent Notification – Avoiding high-crime areas with geofencing when delivering high-valued goods.
204. Extra Penalties – Dishing out extra penalties to criminals if convicted of selling drugs within a specified distance of school property.
205. Illegal Smuggling – Monitoring cross-border smuggling activity by placing a GPS on a vehicle with a warrant to do so.
206. Fear of Crime – Interviewing individuals for fear of crime using GPS-enabled mobile computing.
207. Geographic Profiling – Using a connected series of crimes to determine the most probabilistic location of a criminal offender or offense which is useful for finding serial criminals.
208. Stalking – Abusing GPS technology by stalking with a GPS receiver. A GPS jammer prevents positional monitoring.
209. First Response – Getting to a crime scene quicker with all the critical information needed in the field. (Adashi Incident Command Software)
210. Traffic Violations – Collecting and mapping traffic incidents to assess if units should be spread out or concentrated in certain locations.
211. Open Air Drug Markets – Uncovering the relationship between crimes and the location of open-air drug markets based on analogous crimes throughout other communities
212. Ankle Monitor – Homing in on those under house arrest or parole. GPS bracelets only have value if you know where they are going.
Defense

213.增强现实沙盘 (ARES) – 使用沙盘上的投影 GIS 数据改善战场和军事可视化。(增强现实)
214.恐怖主义搜索– 使用带有生物地理学理论(距离衰减理论和岛屿生物地理学理论)的遥感图像寻找奥萨马·本·拉登。(寻找奥萨马·本·拉登)
215.防空– 使用 3D 圆顶层回答高射炮射程以避免危险的空域(防空)
216.安全着陆– 通过评估该地区的潜在环境安全地从天空跳伞。
217.情报数据集成– 为战场应用叠加准确的地理数据并做出挽救生命的决策
218.作战飞行规划软件 (CFPS) – 在 Falcon View 中预览作战路线、武器投放和空投规划。(Falcon View)
219.侦察卫星——用卫星监视敌人——从 1959 年的 Corona 到今天使用的小型 CubeSat。
220.基地建设规划– 使用 3D 天际线工具在附近主要道路不可见的情况下建设基地。
221. GEOINT – 通过使用地理空间调查和紫外到微波图像揭示人类活动。
222.军事模拟– 在高度逼真的虚拟世界中模拟地面车辆。
223.美国陆军工程兵团——提供重要的公共和军事工程服务,牢记地理空间信息。(美国陆军工程兵团)
224.鸽子测绘– 在第二次世界大战中与巴伐利亚鸽子队一起监视敌人 – 一群配备相机的鸽子。
225.阻塞点——保护关键基础设施汇聚的桥梁或水坝等阻塞点——这里的爆炸会造成多重影响。
226. Bird Strike – 安全飞行避鸟模型 (BAM) – 一个时间栅格网格,等于现有所有物种的平均鸟类质量的总和。
227.铀枯竭 – 绘制贫化铀地图并防止其落入坏人之手。
228.暗杀总统——通过了解过去的后勤情况来防止暗杀。
229.移动指挥建模——通过找到最佳移动指挥位置来建立商店。
230.通用操作图片– 让每个人都在同一页面上使用通用操作图片。
231.军事任务规划——通过 3D 提高直升机飞行员的操作意识,以进行进出运动。
232.位置情报– 为地对地武器(地表危险区)和空对地武器危险区创建安全和危险区域。
233.联合国维持和平——在饱受战争蹂躏的国家中使用必要的人道主义援助和发展和平。
234.关键特征——通过收集建筑和文化环境的知识来识别对国土安全的威胁。
235.战术规划——通过搜索压缩和快速加载的侦察图像,智能地将部队和军事装备部署到作战区域。
236.动态视频– 捕获地理参考视频以评估任何内容,例如工业厂房的运行状态、目标上的炸弹损坏或跑道长度。(GeoMedia Motion 视频分析师)
237.国土安全– 解决漏洞并制定应对恐怖主义和紧急情况的准备措施。
238.虚拟现实——使用 GIS 数据在 3D 环境中模拟军事和训练。
239.攻击建模– 对潜在攻击进行建模以使需求合法化,并让决策者真正了解攻击的后果以及准备支出。
240.直升机降落– 盘点未见、未闻和平坦地形上直升机的潜在着陆区。
241. Guard Posting – 在最佳位置部署武装警卫以消除阻塞点。
242. 3D Fences – 在 3D GIS 环境中构建具有后间隔和多个具有高度的电线/板的安全围栏。
243.战争地图– 通过绘制战略攻击地图来熟悉敌人的防御和领土。
244.世界贸易中心——应对恐怖袭击,包括实时数据传输、受害者跟踪、设施和资源脆弱性、数据可用性、实施、环境暴露和空气监测(世界贸易中心 GIS 响应)
245. Georeferenced Video – 使用 ArcGIS Full Motion Video Add-In 或 Hexagon Geospatial GeoMedia Motion GeoVideo Analyst 对全动态视频进行编目和检索。
246.检测简易爆炸装置 –日复一日地监测受干扰的表面,以发现简易爆炸装置
247.后勤– 通过及时的后勤和支持响应军事和安全决策。
248.伪装探测——在战争期间使用近红外进行早期侦察任务。
249.军事网格参考系统– 将地球上的点分为三个部分 – 网格区指示符、正方形标识符和数字位置。
灾难

250. Richter Scale – Depicting earthquakes on a 3D globe like spikes on a porcupine for each reading on the Richter scale.
251. Shared Operations – Responding to disasters with quickness and reliability using a Common Operating Picture and cloud services (Cloud GIS for Disaster Monitoring)
252. Chernobyl Exclusion Zone – Buffering a radius of 18.6 miles (30 km) which is now known as the Chernobyl Exclusion Zone.
253. Landslide Vulnerability – Dodging landslides with relief maps and 3D analysis.
254. Hurricane Response – Sidestepping the threat of hurricanes by tracking historical hurricane paths and through better disaster response/assistance.
255. Earthquake Prediction – Obtaining earthquake signatures measuring subduction events with GRACE satellite and the geoid. (Earthquake Prediction)
256. Coastal Surges – Estimating risk in three steps using HAZUS software by FEMA.
257. Citizen Alert – Guaranteeing protection of citizens by delivering geo-targeted alerts on mobile. (FME Server Real-Time Earthquake Reporting)
258. What-if Scenarios – Determining higher likelihood events based on historical data and spatial analysis.
259. Evacuation – Evaluating evacuation capabilities neighborhoods may face and generating effective design.
260. Oil Spill – Degreasing oil spills by identifying the current direction and rate of oil movement.
261. Tornado Warning Siren – Safeguarding residents with effective siren coverage in tornado alley. (Tornado Warning Siren Modelling)
262. Fire Severity – Prioritizing prevention and planning efforts during forest fires.
263. Flood Forecasting – Simulating with stream discharge hydrographs with variations of water over time.
264. Tornado Alley – Finding patterns of historical tornadoes in Tornado Alley.
265. Avalanche Modeling – Uncovering areas prone to avalanches by assessing high slopes with sparse vegetation for residential planning, ski resorts, and highway safety planning.
266. Tsunami Damage – Identifying high-risk areas for tsunami damage
267. Emergency Shelter – Allocating emergency shelter at the time of disaster
268. Consequences Assessment Tool Set (CATS) – Analyzing damage to the environment and providing real-time resource allocation information to mitigate the consequences. (Leidos Consequences Assessment Tool Set)
269. Vulnerability to Natural Hazards – Deselecting hazard-prone land for more resilient communities through smart land planning.
270. Search and Rescue – Rescuing missing people by using small, highly maneuverable unmanned aerial vehicles (drones).
271. Volcanic Ash – Rendering volcanic ash clouds in 3D for their dispersion of spillages underwater.
272. Earthquake Epicenter/Hypocenter – Establishing the epicenter, hypocenters, faults and lineaments, radius, and frequency of earthquakes.
273. Volcano Activity – Monitoring thermal emission from the volcano’s summit in Iceland using Landsat’s Thermal Infrared.
274. Disaster Warning – Alerting citizens before a large-scale earthquake happens with a new generation of inter-operable early warning systems for multiple hazards. (DEWS – Distant Early Warning System for Tsunamis – uDig)
275. Earthquake Assistance – Assisting in the aftermath of the massive Ecuador earthquake by listing “Safe Place” locations from government listings. (Waze Community Assistance)
276. Disaster Debris – Estimating debris amounts to better prepare and respond to a major debris generating event.
277. Earthquake-Landslide Susceptibility – Mapping the susceptibility of earthquake-induced landslides using artificial neural networks and factors such as slope, aspect, curvature, and distance from drainage. (Earthquake-Landslide Susceptibility Using Neural Networks)
Ecology

278.遥测——从有项圈的哺乳动物收集 GPS 位置,用于存储、显示和分析它们的坐标。
279.栖息地适宜性——考虑所有变量以了解动物选择的栖息地并避免使用线性回归。
280. Land Facet Corridor Analysis – 识别野生动物和景观之间的联系。(Land Facet Corridor Analysis)
281. Landscape Fragmentation Tools (LFT) – 将土地覆盖类型分类为森林破碎类别 – 斑块、边缘、穿孔和核心。(Landscape Fragmentation Tools LFT)
282.迁移模式– 模拟东非塞伦盖蒂-马拉生态系统的东非角马迁徙模式。
283. Path Metrics – 使用 GME 计算点时间序列数据集的转角、步长、方位和时间间隔。
284. DNA 特征– 基于分子标记 (DNA) 绘制景观中生物的丰富度、分布和多样性。
285.苏瑞部落——为苏瑞部落配备地理标记设备,以结束巴西热带雨林地区的森林砍伐和文化破坏。(苏瑞部落)
286.物种生物多样性– 使用时间 GIS 来衡量随着时间的推移生物多样性的减少或物种的丰富(入侵或干扰增加)。(不列颠哥伦比亚省折射生物多样性)
287.蜜蜂– 通过分析环境特征与蜜蜂健康和丰度之间的关系来刺激空间思维过程(GIS 蜜蜂研究)
288.麋鹿范围– 使用Hawth 工具中的最小凸多边形。
289.人为干扰——通过直升机调查监测哺乳动物来了解输电线路建设的影响。去乔巴吧!
290.候鸟– 与兰利空军基地飞行行动交叉参考遥测 GPS 迁徙(鱼鹰)鸟类位置,以减少飞机袭击。(NASA Langley Research – 鸟类/野生动物飞机撞击危险)
291. Shannon 的 H 多样性指数– 以数学方式衡量社区中的物种多样性和丰富度。
292.小气候– 使用方面数据分析阳光照射,作为小气候和物种发生的指示。
293.地形崎岖指数– 估计地形异质性,这有助于预测物种使用哪些栖息地
294.去灭绝– 让灭绝的物种恢复生机并标记它们以前的栖息地——比如几十年内从 50 亿只鸟减少到零的旅鸽。
295. Sky View – 最大化可见天空的部分并了解潜在的森林栖息地。
296. FragStats – 计算分类地图模式的各种景观指标。
297.地形位置指数——将景观划分为斜坡位置和土地形态类别
298.全球生态土地单位——表征全球生态系统(USGS)的独特物理环境和相关土地覆盖。(全球生态土地单位)
299.生物地理学– 沿着纬度、海拔、隔离和栖息地的地理梯度研究地理空间和(地质)时间的生态系统。
300.物种建模——运行最大熵模型(MAXENT)。(QGIS 物种分布建模 (QSDM) 插件)
301. Flocking Birds – 使用基于代理的建模在交互式部件系统中模仿成群的鸟类。(NetLogo 植绒鸟类)
302.灭绝风险——描述栖息地的现有状况并预测灭绝风险、恢复的机会和缓解措施——例如禁止狩猎。
303.栖息地优先规划师– 通过 NOAA 的栖息地优先计划者优先保护、恢复和规划。(栖息地优先计划者)
304. DNA条形码 – 在对生活进行条形码时附加特定位置。史密森尼学会国家自然历史博物馆——(DNA 条形码——自然历史)
305.地理信息系统保护协会(SCGIS) ——通过社区参与和自然资源和文化遗产的保护来协助世界各地的保护主义者。( SCGIS )
306.保护区生态重要区域——将显着、有代表性和/或敏感的海洋栖息地、社区和生态过程划定为 SESA。(保护区生态重要区域)
307.哺乳动物磁性排列 – 通过卫星图像分析和对雪中鹿床身体排列的现场观察,发现鹿如何感知磁性。(美国国家科学院院刊 2008 年)
308.可持续人口计数– 通过分析两个卫星图像随时间推移计算北极熊及其地理分布。
309. Crocodile Eggs – 实时监测鳄鱼蛋的温度和湿度等因素。(鳄鱼蛋实时监控)
310.走进奥卡万戈– 在日记风格的地图中徒步穿越奥卡万戈 – 世界上最后一片大湿地荒野和联合国教科文组织世界遗产。
311.世界动物保护——对未来的灾害更有抵抗力。(世界动物保护)
312.线性方向平均值——确定麋鹿和驼鹿在溪谷中的移动趋势可以计算出这两个物种迁徙路线的方向趋势。
313. Wa-Tor Predator-Prey Simulation – 模拟具有随机性和基于规则的响应的生态捕食者-猎物种群。
314. Golden Eagle Tracking – 使用 Manifold GIS 中的生物多样性跟踪系统跟踪金鹰种群。
315.Earth Trends Modeler – 评估长期气候趋势,测量物候学的季节性趋势,并分解图像时间序列以在 IDRISI TerraSet 中寻找空间和时间的重复模式。
316.生态屏障——标记物种之间物理隔离的屏障。
317.地理标记照片– 通过地理标记指定野生动物照片位置,并使用 ArcPhoto 简化导入过程。
经济学

318.空间计量经济学——空间分析与经济学的交叉。(GeoDa)
319.世界经济展望– 用世界经济展望预测未来经济和主要宏观经济指标 – 国际货币基金组织(世界经济展望)
320.货物流动– 说明人或货物从点到点的流动,基于价值与欲望线。
321.全球化——利用国际贸易数据随时间推移衡量经济全球化的程度和程度。
322. Thünen 模型——在空间中分配生产本身,包括运输成本和要素流动性。
323.经济自由– 绘制全球经济自由地图 – 由华尔街日报和传统基金会出版的年度指南(经济自由热图)
324.地理投资组合– 为世界不同国家和股票市场在地理上多样化您的股票投资组合。
325.全球贸易——从一个地方开始到另一个地方结束的出口货物。
326.地理创新指数——调查地理接近创新资源和股票回报之间的关系。(地理创新指数)
327.经济基础指标– 查看基于径向、驱动力和邻近度的商业、工业和人口统计的经济指标。
328.专题制图——在时间序列专题图中描绘失业和劳动力信息等经济数据,因为地图与人对话
329.专属经济区(EEZ) ——划定关于勘探海洋地表以下海洋资源的主权边界sea
330.国内生产总值– 创建连续区域制图。(Cartogram QGIS 插件)
331.全球向新经济转型——通过众包可持续项目地图优先考虑人类福祉。(全球向新经济转型)
332.贸易区——划定一定比例的商店顾客居住的地理区域。
333.污染的经济成本——通过了解环境退化的现状来评估印度的绿色增长选择和污染成本。
教育

334. Campus Navigation – Navigate through a university campus with online mapping applications.
335. Neogeography – Opening the floodgates for individuals to create their own maps, on their own terms and by combining elements of an existing toolset
336. Projection Art – Investigating our Earth by understanding map projections.
337. Macroscope – Seeing through the macroscope – our earth as a whole rather than be taken apart in its constituents. (Macroscope)
338. Bus Services – Assessing which addresses in proximity to a school are eligible for busing.
339. Safe Routes to School Mapping Toolkit – Deciding the safest route to school.
340. Geospatial Revolution – Captivating audiences with the Penn State Geospatial Revolution
341. Cartographic Modelling – Using map algebra to depict the relationships of transportation and geography on access to adult literacy centers in Philadelphia.
Energy

342. Nuclear Power Risk – Conceptualizing nuclear power plant radioactive release with evacuation time and population exposed.
343. Marine Renewable Energy – Seeing the ocean of information with wave heights and wind for electric dam selection.
344. Concession – Putting concession licenses that give a company the right to drill for oil or gas and exploratory drilling boreholes on a map.
345. World Power Types – Seeing how much of the world is being powered by fossil fuels, nuclear and renewable sources. (What Powers the World?)
346. Nuclear Waste Site Selection – Safeguarding people with proper nuclear waste disposal
347. Water Yields and Scarcity – Estimating water yields and scarcity at a sub-watershed level to calculate hydroelectric potential to the year 2100. Water Scarcity with Ecosystem Services Modeler IDRISI – The Ecosystem Services Modeler (ESM)
348. Access Limitation – Calculating access limitations for building like slope being a major factor for getting wagons up the hill to the site.
349. Coal Stockpiles – Capturing satellite imagery of frequent shots of open pit mines and resource stockpiles to better understand how much coal has been mined each month. (Coal Stockpiles)
350. Shale Gas Plays – Depicting current and prospective shale gas resource areas in shale basins from the Energy Information Association.
351. Dam Sites Selection – Comparing hypothetical dam sites by potential water storage to understand how land use/land cover is impacted.
352. Energy Consumption – Drawing out energy capacity and consumption on a map. (World Energy Consumption Map)
353. Wind Farm Site Selection – Selecting suitable wind farms by understanding wind power, transmission capacity, road access, and developable land.
354. Turbine Visibility – Discerning visibility of wind for potential changes on a landscape, such as the effects of adding wind farms, or the addition of a new building to an urban area.
355. Radar Interference – Calculating potential radar interference and conflicts between turbines and airport approach/landing surfaces with 3D analysis.
Engineering

356. Asset Management – Managing infrastructure data maintenance along with their lifecycle.
357. Building Permits – Helping the user determine whether or not a requested permit is in a historic district, an aquifer protection district, wetland, or floodplain.
358. CAD Interoperability – Integrating CAD data (DWG, DXF) into GIS and vice versa.
359. Construction Environmental Management Plan – Mitigating the potential negative impacts of engineering projects by identifying environmentally sensitive sites and mitigation measures.
360. COGO – Constructing points, spirals, curves, and arcs with coordinate geometry.
361. Real-time Sensors – Monitoring carbon monoxide in real-time with GeoEvent Extension with set thresholds and alerts (Valarm Monitoring Company)
362. Augmented Reality – Pulling up engineering diagrams and real-time sensor networks to view water pressure or amperage. (Augmented Reality)
363. Cut & Fill – Carving out 3D cut and fills for major civil engineering projects such as major road constructions.
364. Department of Interior – Constructing dams, power plants, and canals for protecting water and water-related resources in the United States. (Bureau of Reclamation)
365. Facility Management – Optimizing energy efficiency with building automation services for a more comprehensive view of a building.
366. Artificial Dam – Damming a site artificially by raising the elevations along a dam site using a Euclidean distance grid and map algebra.
367. Development Area – Getting the big picture by tapping into GIS data like gentle slopes, and closeness to roads.
Environment

368. Environmental Impact Assessment – Measuring anticipated effects on the environment of a proposed development project
369. Site Remediation – Removing contamination from a plot of land detailing risk exposure and an overview with maps.
370. Fire Growth Simulation – Extinguishing fires faster by understanding how they grow in discrete steps bringing together wind, weather, and fuel for the fire. (FireScience BehavePlus)
371. Surface Water Flow – Characterizing water flow to be identified as a high consequence for oil spill mitigation.
372. Dead Zones – Mapping out dead zones where marine life is unable to be supported.
373. Canadian Land Inventory – Charting out the land capability to sustain agriculture, forestry, and recreation.
374. Non-point Source Pollution – Modelling non-point source pollution like soil erosion and sedimentation which are often controlled by variables such as land use/cover, topography, soils, and rainfall.
375. Wetland Inventory – Delineating wetlands by types and function. (National Wetlands Inventory)
376. Invasive Species Modular Dispersal – Modelling the spread of a species’ population distribution through time occupancy maps (GRASS GIS Species Dispersal)
377. Storm Water Runoff – Conserving nearby resources such as water and flora by better managing runoff.
378. Brownfield and Greenfield Sites – Digging up the background information (Phase 1) and conducting the necessary geotechnical analyses to explore economic opportunities at brownfield and greenfield sites.
379. Ozone – Motivating the world to do its part by mapping the spatial distribution of ozone concentrations.
380. SWAT Model – Testing the effectiveness of agriculture and environmental policies for pollution control systems in a given watershed like the mwSWAT Plugin in MapWindow
381. Karst – Identifying known cave and karst resources into a sinkhole digitization database for best interstate alignment selection. (Karst Database)
382. Permafrost – Interpreting permafrost probability in the Yukon.
383. Traffic Sign Deterioration – Assessing the effects of air pollutants on traffic sign deterioration. (Traffic Sign Deterioration)
384. Impoundment Index Tool for Wetlands – Unearthing wetlands with Impoundment Index Tool to site potential wetland restoration projects, monitor wetland drainage, and model beaver habitat. (Whitebox GAT Impoundment Index Tool)
Forestry

385. Forest Inventory – Prioritizing timber harvesting units by referring to age class and forest type to better measure timber acreage and average estimates.
386. Forest Fires – Plotting out forest fires with MODIS. (University of Maryland Forest Fires)
387. Deforestation – Gauging deforestation using land cover change in time.
388. Reforestation – Recharging forests through tree planting planning on a map.
389. Forest Heights – Measuring tree heights with altimetry and noticing how trees generally differ 20m with taller ones at the equator. (GLAS Satellite)
390. Vertical Point Profile – Viewing the vertical profile of 3D LiDAR points to better understand tree structure and height. (TNT LiDAR)
391. Cut Lines – Finding cut lines in ortho imagery to find easy access.
392. Tree Lines – Drawing tree lines in the Canadian Arctic.
393. Illegal Logging – Identify potential illegal activity with satellite data. (Global Forest Watch)
394. Forest Carbon Reserves – Sequestering carbon through forest reserves and carbon observed in the atmosphere.
395. Agent-Based Simulation – Simulating the spread of an agent (like a fire) triggered by random events (such as lightning) on a raster landscape in discrete time.
396. Global Forest Watch – Putting all the pieces together with an integrated forest watch online platform.
397. Drones for Indonesia Indigenous – Promoting sustainable forests using drones in Setulang village, Indonesia. (Drones for Indonesia)
398. Wildfire Rescue – Saving lives through real-time wildfire satellite monitoring.
399. Vegetation Potential – Analyzing tree growth & distribution of vegetation with west/east-facing and aspect data.
400. Leaf Area Index – Summing the total area of leaves per ground unit.
401. Amazon Rain Forest – Maximizing satellite potential viewing soil erosion, watershed destabilization, climate degradation, and species extinction in Brazil.
402. Remnant Rain Forest – Studying aspect data to find how remnants of rainforest are almost always found on east-facing slopes (with aspect) which are protected from the dry westerly wind.
403. 4D GIS – Getting to know the XYZ’s with timber harvesting and subsequent vegetation growth.
404. Age of Trees – Inventorying the XY position and rings of trees in a database to understand their age.
405. Forest Disease – Mapping the impact of how forest infestations like the mountain pine beetle have on forests and the economy. (Google Fusion Tables – Disease Map)
406. Wildfire Simulation – Automating the spread of wildfire in time using the 3D virtual workspace of Capaware.
Gaming

407. Oculus Rift – Building realistic 3D environments with Esri CityEngine because virtual reality is all about location and a sense of place. (Esri CityEngine and Oculus Rift)
408. Building Virtual Environments – Designing future buildings, roads, cities, and parks with video game contributions. (GIS and Gaming – Matt Artz)
409. Geoguessr – Embarking on an educational journey that takes you all over the world (Geoguessr)
410. Mercator Projection Game – Learning about the shape, size, and conformity of the Earth with map projections.
411. Spatial Data Integration – Intersecting the gaming world with rich, real-world, spatial data integration.
412. Planet Hunters – Finding undiscovered planets with crowd-source-style online games. (Planet Hunters)
Gardening

413. Living Plant Collection – Managing garden collections and plant records with the ArcGIS Public Garden Data Model like the UC Davis Arboretum, Arnold Arboretum at Harvard University, and Smithsonian Garden. (Public Gardens GIS)
414. Gardening Microclimates – Studying microclimates (temperature from large bodies of water, topography, urban areas trapping heat) to carefully choose and position their plants and make them thrive.
415. Information Delivery – Inspire and educate your visitors with intelligent web maps of your park or garden.
416. Weeds – Storing weeds and herbicide dosage in a database to manage effectiveness and control measures.
417. Roof Gardening – Assessing average temperatures by zoning, water availability, and position sheltering to identify buildings with the greatest potential for rooftop gardens.
418. Garden Reporting – Creating data-driven reports and mapbooks on collections of plants about conditions and hazards.
Geology
419. Drill Hole Planner – Drilling with 3D planning tools including depth, azimuth and positions.
420. Aquifer Recharge – Determining potential aquifer recharge using steepness of slope and soil permeability
421. Well & Volumetric Data Visualization – Creating powerful, fast, customized 3D models with a fusion of geologic data, GIS data, well/borehole data, and point cloud data. (Voxler Golden Software)
422. Plate Wizard Project – Reconstructing converging and diverging plates through geologic time.
423. Geological Interpretation – Digitizing surficial geology (surface sediments, their morphology and properties) with air photo interpretation and field validation.
424. qgSurf – Interpreting geomorphological analyses based on their surface and orientation.
425. Marine Geology – Inventorying marine geology. (NOAA Marine Geology)
426. Geomorphology Features – Studying the nature and origin of landforms, including relationships to underlying structures and processes of formation.
427. Dip and Strike – Plotting dip and strike readings and their geological orientation with rotational symbols.
428. Digital Rock Engineering – Tunneling underground with attention to existing topography and its surroundings which includes above-ground and underground structures
429. Aeromagnetic Anomalies – Correlating aeromagnetic anomalies with surface geology in a tectonically active region.
430. Continental Drift – Measuring tectonics plate movement with GPS
431. EnterVol Geology – Creating full 3D, volumetric models of geology direct from collected data integrating lithology data with surfaces. (EnterVol Geology)
432. Subsurface Mapping – Mapping the subsurface through well-log data by drillers with standard lithological terms and a classification system
433. Landform Classification – Classifying landforms with qualitative analysis of the surface like summits, passes, convex/concave break lines, crests, and more with gvSIG geomorphology tools.
434. Geologic Structure – Using photogrammetry in inaccessible regions in 2D and 3D cross-sections for geologic structure mapping. (Hexagon Geospatial Photogrammetry)
Geostatistics

435. Spatial Autocorrelation – Testing whether the observed value of a variable at one locality is independent of the values of the variable at neighboring localities. (GeoDa Spatial Autocorrelation)
436. Data Mining – Automating the search for hidden patterns in large databases
437. Spatial Regression – Building spatial regression to models for estimating the relationship between spatial variables. (GeoDa Spatial Regression)
438. Zonal Statistics – Summing, averaging, or finding the range, minimum or maximum in a given range. (Zonal Statistics)
439. Hexagon Tesselation – Defining sampling locations, helping to ensure that all regions within the study area are represented by the sampling results.
440. First Law of Geography – Using Tobler’s First Law of Geography in analysis- “Everything is related to everything else, but near things are more related than distant things.”
441. Semi-variogram – Graphing the variance in measure with the distance between sampled paired locations.
442. Space-Time Cube – Binning data (netCDF) into a cube input and running statistics, trends, and hot spot analyses over time. (ArcGIS Space-Time Cube)
443. Map-ematics – Making math operations in maps like adding, subtracting, multiplying, dividing, exponentiation, root, log, cosine, and differentiation (Map-ematics – Joseph Berry)
444. Kriging – Interpolating unknown measurements using kriging and other techniques.
445. Analytical Hierarchy Process (AHP) – Combining input layers and a table with several factors comparing their comparative weights to calculate a new layer as a linear combination of the input layers.
446. Ordered Weighted Average (OWA) – Calculating the weighted average of a group of layers based on the order of values. (OWA – gvSIG)
447. Fishnet – Creating a fishnet to correlate the coefficient between boating accidents and dams using a fishnet.
448. Geospatial Modelling Environment – Leveraging open source software R as the statistical engine to drive powerful analysis tools in ArcGIS.
449. Principal Components Analysis – Reducing dimensions with Principal Components Analysis. (Principal Component Analysis)
450. Data Visualization in R – Writing each line of code to programmatically create maps (R Data Visualization – Robin Lovelace)
451. Fuzzy Logic – Applying fuzzy logic with degrees of truth because often does not have clearly defined boundaries.
452. 数据透视表– 在 QGIS 中生成动态数据透视表。(QGIS Group Stats Plugin)
453. Monte Carlo Simulation – 使用模拟模型对空间现象进行建模。
454. Minkowski 泛化– 使用 Minkowski 分形维数确定对象的复杂程度(Minkowski–Bouligand 维 QGIS 插件)
455.地图代数– 应用局部、焦点和区域函数技术。(Dana Tomlin 的“GIS 和制图建模”)
地下水
456.达西流– 检查地下水流通过沙子等粗材料的运动。
457. MODFLOW – 对地下水需求进行建模并预测盆地中地下水需求的影响。(Aquaveo 水建模)
458.地下水可用性– 分析土地利用实践与水的可用性和质量。
459. Aquifer Recharge – 测量渗透率补给量并量化随时间的增长。
460.地下水羽流——描绘地下水污染及其变化。
461.水文地层学– 根据含水层水力特性识别可绘制单元。
462.DRASTIC – 根据水文地质参数评估地下水资源污染的脆弱性。
463. 3D Borehole – 用倒置深度符号化地下数据,如钻孔大小。
464.地下水量– 通过检查现有地下水和地表水来确定钻探新井。
465.地层学– 绘制钻孔、横截面和测井记录。( Golden Software Strata )
466.污染– 评估对建设和定位工业厂房、垃圾填埋场、农业活动和其他潜在地下水污染源的影响风险
467.多孔粉扑– 使用 ArcGIS 地下水工具计算垂直混合含水层中离散点的每体积溶质的质量。
468.浅坡稳定性 (SHALSTAB) – 计算作为关键浅层地下水补给值的网格单元。
健康

469. HealthMap – 提供实时的全球疾病监测 ( HealthMap )
470.疾病控制中心 (CDC) – 按种族/民族、性别和年龄组提供县级心脏病和中风地图,以及以下地区的地图整个美国或选定的州或领地的社会和经济因素以及卫生服务。(心脏和中风互动地图集)
471.白血病研究– 调查靠近传输线的白血病集群。
472.约翰·斯诺– 通过研究霍乱病例的空间分布并确定爆发源为布罗德街的公共水泵,打造一个全新的研究领域(流行病学)。
473.埃博拉病毒——绘制埃博拉病毒确诊病例和疑似病例随时间变化的地图。
474.到医疗保健的距离——寻找最近的医生是一个空间问题
475.重要记录——记录事件,例如由公共卫生机构维护的出生和死亡。
476.铅浓度– 关联铅中毒儿童如何被发现更接近旧的铅精炼厂。
477.聚类分析– 使用聚类分析和 GIS 识别建筑环境模式:与步行、骑自行车和体重指数的关系。(聚类分析)
478.欧几里得距离——在禽流感爆发期间寻找到处置地点的距离。
479.疾病监测– 在手持设备上使用 GIS 监测西尼罗河病毒。
480.哮喘——将哮喘与空气污染联系起来。
481.流行病学——在空间数据库中跟踪疾病和流行病学信息。( CDC Epi-Info )
482. UV Exposure – 暴露有害紫外线的风险与出生率。
483.移动流感疫苗– 确定移动流感疫苗车辆的最佳站点位置,以便通过位置分配在最需要的地方提供服务。
484. Geomedicine –跟踪患者的位置历史,以确定环境和工业危害是否使他们面临某些类型疾病的风险
485. Madrid’s Air – 可视化马德里的空气(气体、颗粒、花粉、疾病等),以使微观可见和隐形代理人。(马德里的空中地图)
486.救护车响应——以最快的地理路线更快地响应紧急情况。
487.婴儿死亡率– 跟踪儿童免疫接种的死亡率。
488.食品信托– 贫困和肥胖、生鲜超市、与饮食相关的疾病等重叠因素 – 政策制定者的目标空间
489.公共卫生信息学– 确保患者通过公共卫生保健信息学获得所需的护理。
490. Walgreens Prescription Mapping – 根据客户为更有效地响应用户需求而制定的处方绘制和分析流感。
491.疾病传播模式——随着时间的推移绘制疾病爆发的椭圆以模拟其传播。
492.可步行性——将可步行的社区与心脏病、高血压、肥胖症甚至乳腺癌等健康疾病拼凑在一起。
493.反吸烟运动——针对目标受众最需要和最明显的反吸烟运动。
494.癌症研究– 使用 Landsat 卫星从天空研究癌症。(Landsat 癌症研究)
495.蚊媒疾病– 确定蚊虫感染指数高的区域,并解释这些区域与潜在的幼虫发育地点(如垃圾堆和大型死水池)的空间关系。
496. HIV AIDS Database – 分发 HIV/AIDS 以管理治疗。
497.远程医疗– 量化可供患者和医疗保健提供者使用的人口和医疗保健。
历史

498.沉船——通过 SHIPS 项目记录沉船、飞机、船体、失锚和海床上的任何其他物体的残骸。
499.美国自然历史博物馆——应用生物多样性信息来收集、组织和分析生物和环境数据,为保护、生态和进化提供新的见解。
500. Topoview Slider发布带有滑块样式地图的地图,以查看一个区域在开发之前的外观以及它如何随时间变化。( USGS Topoview )
501.密克罗尼西亚航海图– 使用棒状图作为海洋膨胀模式的独木舟导航。
502.历史照片– 在增强现实中对历史照片进行地理定位。(WhatWasThere 应用程序)
503.巴比伦人– 在粘土上蚀刻土地。
504. Old Weather – 通过研究天气模式跟踪过去的船舶运动并讲述船上人员的故事。(旧天气)
505.朝圣– 踏上朝圣之旅并绘制旅行距离的地图。
506. Boundary Changes – 探索边界如何随时间变化,例如二战后。
507. Spy Glass – 由 Esri 提供支持的时间旅行回到 1836 年的纽约。(史密森学会)
508。工业革命放射性——自工业革命以来将放射性放在地图上。
509. 3D 历史飞越– 使用 ArcScene 在历史图像中翱翔。
510.烟雾信号– 当使用烟雾信号时,使用视域来设身处地为美洲原住民着想。
511.祖先– 通过祖先与地球系统发育进行调查 – 共同祖先的演变和地理分布和地理连通性。
512. ArcGIS Online 历史地图——探索旧的 USGS 历史地图。(USGS 历史地图)
513.曼哈顿移民模式– 展示曼哈顿的移民如何不仅随空间而变化,而且随时间变化。(过去的时间,过去的地方:历史的 GIS)
514.阿兹特克与墨西哥姓氏——将当前地名与历史地名对齐,以了解阿兹特克文化的古代地理。(阿兹特克人和墨西哥人的姓氏)
515.巫术指控者——收集塞勒姆女巫审判期间指控者和被指控者的地理位置,以表明家庭间的不和是审判的有力案例,而不是年轻女孩的歇斯底里。
516.文化保护– 保护其文件仍必须定位并输入到此 GIS 中的历史财产。
517.盘古大陆– 绘制我们今天看到的从盘古大陆到地球的大陆演化的不同阶段。
518. Napolean’s March to Moscow in 3D – 使用 Esri 的 CityEngine Napolean’s March to Moscow 在时间片中可视化部队移动、城市、底图和温度。(拿破仑三月在 3D 中)
519.地理配准历史图像– 使用地理配准拉直历史图像。
520.人类活动模式– 在地图上雕刻活动,显示具有时间启用的 GIS 的人类运动模式。
521.陆桥——同意“陆桥”的可接受术语——这是一个可用的区域,因为水被冰盖束缚。
522.刘易斯和克拉克——绘制刘易斯和克拉克探险队的图表。
水文
523. Braided Rivers – Managing braided rivers with their complex geometry and state in flux.
524. Sedimentation Rate – Characterizing erosion and sedimentation with the Sediment Transport Index.
525. Catchment Areas – Delineating watershed catchment areas, where rainfall flows into a river. (Mapping Watersheds in Whitebox GAT)
526. Topographic Wetness Index – Combining slope and upstream area to give you the relative measure of wetness as the first place where the ground saturates, begins to pool, and generates runoff.
527. Flow Direction – Coding the direction of flow with eight valid directions. (Flo 2D)
528. Flow Estimator – Estimating flow rates with a series of spatially-located gauging stations.
529. Height Above River – Generating predictive surfaces for plant species distribution modeling using high-resolution DEM data. (LiDAR Height Above River)
530. Sinuosity – Measuring the degree of channelization and meandering for a given watercourse.
531. Stream Feature Extractor – Extracting stream features (wells, sinks, confluences, etc.) from a stream network. (Stream Feature Extractor QGIS Plugin)
532. Hydrologic Volume – Measuring volumes for the Hydrologic Budget Equation and amount of precipitation in a given watershed.
533. HEC-HMS – Simulating the complete hydrologic processes of dendritic watershed systems with the HEC-HMS GIS-based methodology.
534. Flow Accumulation – Answering the question “where did water come from” by picking a point (a single cell in the DEM) and tracing backward showing all the contributing cells. (TauDEM)
535. SCALGO – Understanding Earth’s hydrology as a function of topography using the SRTM DEM. (SCALGO)
536. GHydraulics – Analyzing water supply networks using EPANET. (Ghydraulics QGIS Plugin)
537. Aqueduct – Mining, modeling, and analyzing water risk with the current and future stresses.
538. Contour Lines – Delineating contour lines because floods follow contour lines.
539. Flood Extents – Digitizing flood extents worth satellite data like synthetic aperture radar.
540. BASINS (Better Assessment Science Integrating point & Non-point Source) – Running water quality assessments with land use, point source discharges, and water supply withdrawals.
541. Crayfish QGIS Plugin – Animating flood model outputs and flood propagation. (TUFLOW)
542. ArcHydro – Operating ArcHydro in ArcMap to delineate and characterize watersheds.
543. Drainage Channel Builder – Cutting a simple, trapezoidal channel in a DEM and calculate cut volumes. (Drainage Channel Builder QGIS Plugin)
544. HEC-RAS Flow Model – Predicting where the water will go (flooding) to prevent inundated roads and inaccessibility. (RiverGIS QGIS Plugin)
545. Horton Statistics – Calculating the number of streams, the average stream length, and the average area of catchments for Strahler stream orders
546. Flow Stations – Marking flow stations on a map.
547. Water Shortage – Modelling water shortage in California
548. Upstream/Downstream – Finding the origin of water from a specific point. (Hydro Hierarchy)
549. MIKE21 – Simulating physical, chemical, or biological processes in coastal or marine areas.
550. Oxbows – Mapping the evolving process of how rivers change in time and become oxbows
Humanitarian

551. Election Violence – Reporting issues like outbreaks of violence, intimidation, or vote fraud during Tanzania’s election. (Restless Development – What3Words)
552. Ushahidi Haiti Project – Plotting out crisis reports during the Haiti earthquake for humanitarian/tech workers aid with crowdsourcing. (Ushahidi Haiti Project)
553. Humanitarian OpenStreetMap – Responding to humanitarian issues and economic development through open data sharing. (Humanitarian OpenStreetMap)
554. Community Engagement – Harnessing human potential by leveraging open data and civic technology. (Kathmandu’s Living Labs)
555. Kibera Slum – Mapping sites of rape and crime by the people themselves to solve where a police station should be located (and more). (Kibera Slum)
556. Crisis Mapping – Using drones to aid Nepalese in a time of crisis.
557. Food Security – Delivering assistance with expected outputs to those in need most.
558. Humanitarian Assistance – Plotting the spatial distribution of humanitarian assistance for planning purposes.
559. Food Insecurity Drivers – Pinpointing the underlying drivers of food insecurity such as farming practices, climate change, and changing demographics.
Insurance

560. Insurance Risk – Charging higher insurance premiums in flood-prone areas using radar
561. Monitoring Driving Habits – Fastening seat belts and monitoring people’s usage to charge car insurance.
562. Insurance Fraud – Doing the detective work for fraudulent crop insurance claims
563. Floodplain – Minimizing losses by flooding through FEMA flood maps.
564. Real-time Hazard – Using location intelligence to Identify areas of hazard in real-time.
565. Climate Change Risk – Adjusting to climate change with better future risk prediction.
566. Social Media Integrating – Finding all Flickr posts within 100 meters of property during incidents.
567. Sinkholes – Preventing risk by understanding landscape characteristics – such as resulting depressions in a karst landscape.
568. Underwriting – Accelerating underwriting by sharing enterprise geographic data with risk factors, customer interaction, and economic conditions.
569. Swimming Pools – Crowdsourcing the search for swimming pools from sponsored campaigns that compile public and private sector data for a variety of markets including education, public safety, and insurance.
Internet

570. Geoblocking – Limiting your access to the internet, based on your geographic location.
571. Hyperlinking – Embedding hyperlinks with access to actual photos, video, audio, text, and data associated with map locations.
572. Mapzen Search – Searching geographically with a spatial search engine for places based entirely on open-source tools and powered by entirely open data. (Mapzen Search)
573. Geosocial Tools – Searching Twitter geographically for tweets with the gvSIG Geosocial Toolbox.
574. GIS-Based Search Engine – Correlating products and services to a GIS database record that corresponds to a unique geographic location – to geographically target advertising over the Internet (GIS-Based Search Engine)
Land Use Planning

575. Urban Model Development Feasibility – Evaluating multiple land use scenarios; testing and refining transportation plans; producing small-area concept plans, and modeling complex regional issues with Envision Tomorrow (Envision Tomorrow)
576. Land-use Conflict Identification (LUCIS) Model – Making smart land-use decisions with a model-builder framework land-use conflict identification strategy. (Smart Land-Use Analysis: The LUCIS Model)
577. Beijing Building Footprints – Crowd-sourcing digital mapping of Beijing building footprints.
578. Food Deserts – Accessing grocery stores in low-income areas by incorporating information such as sidewalks, bicycle lanes, and public transit.
579. Service Areas – Measuring how far paramedics and firefighters can service an area.
580. Agent-Based Models – Exploring cities using Agent-Based Models and GIS. (GIS Agents)
581. Cloud Computing-Based Land Base Mapping – Bringing land use planning to the cloud for Smart Cities like the City of Portland. (Cloud Computing)
582. OpenStreetMap – Harnessing the power of the OpenStreetMap by downloading the physical data for free (OSM Download)
583. Landfill Site Selection – Analyzing and eliminating sites within a buffer distance of sensitive populations (elderly, schools, hospitals, etc) and other overlay information like groundwater, transportation networks and surface water.
584. TerraClip – Clipping data like you’ve never clipped before – extracting land cover, climate, and agriculture data easily to the extent of your chosen country. (TerraClip)
585. Green Roofs – Greening roofs in metropolitan areas with a focus on lighting and shadow analysis.
586. Stamen Maps – Orienting yourself with Stamen’s terrain maps with hill shading and natural vegetation colors.
587. Cellular Automata – Stimulating urban growth expansion simulation. (IDRISI Cellular Automata)
588. Tax Parcel Viewer – Assembling tax parcels and zoning information with color schemes on a web viewer.
589. Economic Viability – Making decisions on parcels of prime agricultural land using the Analytic Hierarchy Process.
590. Water Distribution – Tracking flow, pressure, and chemical concentrations for nodes, valves, pipes, and tanks in a water distribution modeling software. (EPANET)
591. Commercial Space Availability – Checking zoning data for any city such as commercial space availability.
592. Land Use Policy – Reproducing individual behavior with agent-based modeling to simulate their behaviors and outcomes having a direct impact on the surrounding landscape. (Agent-Based Modeling)
593. City Heating – Addressing the GIS requirements of municipal hot water heating networks in Tatuk GIS (Tatuk GIS- City Heating)
594. Commuter Shed – Finding where the commuter sheds are.
595. Recycling Centres/Drop-offs – Allocating recycling drop-off centers with data integration and quantification and assigning alternatives for vehicle routing.
596. Walkshed – Calculating walking times using Tobler’s hiking function based on slope (QGIS Walking Time Plugin) Walkshed Web GIS
597. 3D Viewshed – Showing what is visible with distance, direction, and pitch with viewable areas in green and hidden areas in red. (3D Viewshed – Geomedia 3D)
598. Anaglyph 3D – Viewing anaglyph 3D images with the SAGA GIS Anaglyph Tool.
599. Land Use Change – Summarizing statistics, graphs, and tables in spatial units
600. Tax Collection – Increasing tax revenue by updating land and building property records, new construction records, and integrated departmental data into a single cadastral information system using Bentley Map.
601. COAST COastal Adaptation to Sea level Rise Tool – Adapting to climate change decisions (building sea walls, proactive building ordinance, levees, zoning change, relocation with COAST. (COAST – Global Mapper)
602. Space Syntax Models – Gaining a better understanding of human behavior and connectivity through a graphic representation of space configuration in urban structures.
603. Philadelphia Redevelopment – Developing urban planning scenarios using a 3D swipe view. (Philadelphia CityEngine)
604. Future Development Patterns – Locating future growth and evaluating scenarios such as loss of prime agricultural land.
605. Land Use – Generating polygons and classification with the multi-resolution segmentation algorithm. (Trimble ECognition)
606. Building Constraints – Prohibiting construction where the overall stability of a bluff using aspect to understand how- south-facing slopes undergo more extensive freeze/thaw cycles.
Mail Services

607. National Addressing – Delivering parcels to a specific address, all speed in a single national database.
608. Natural Area Coding System – Unifying the representations of geographic coordinates, area codes, street addresses, postal codes, map grids, and property identifiers of every location or area in the world.
609. Shared Mailboxes – Spreading mailboxes out to address demand and existing population with algorithms like location-allocation.
610. Amazon Mail Delivery Drone – Shipping parcels in style using drone technology.
611. Non-Address Delivery – Generating addresses for businesses and people without one using a 3×3 meter global grid system.
612. Zip Code Maps – Splicing the nation with geo-located zip/postal codes and Mapping them out.
613. Daily Routing Efficiency – Balancing postal routes based on time and optimizing routes, number of routes, or volume with sequenced stops. (ArcGIS RouteSmart)
614. FedEx Package Tracking – Meeting timelines and managing routes for special types of deliveries.
Media

615. Targeting Advertising – Positioning advertisements for target demographics using census data and the right location.
616. Communicating Stories – Storytelling in news events with maps such as oil spills, crime scenes, and weather damage.
617. Social Media Mapping – Monitoring social media by location.
618. Movie Maps – Creating ultra-realistic 3D cities for big box office movies. (Esri Goes to Hollywood)
619. Bigfoot Field Researchers Network – Finding Bigfoot in a spatial sightings database. (Bigfoot Research)
Municipality/Urban

620.坑洼——报告坑洼或使用 LiDAR 自动检测坑洼以进行基础设施管理。
621.资产管理– 使用照片和地理位置报告基础设施缺陷。(波特兰市 PDX 记者应用程序)
622.智慧城市——将城市发展愿景与 GIS 相结合,例如智慧城市规划、智慧公用事业、智慧交通、智慧公共工程和公民参与。
623.地图中的伦敦 – 用 100 张地图和图形以前所未有的方式绘制英国伦敦的生活。
624. 3D Printing Oslo – 打印奥斯陆市的 3D 模型,并在 FME 中进行数据准备。(奥斯陆 3D 打印)
625.水管断裂– 在工作之前准确了解水管和截止阀的位置。
626. Lightscape – 照亮桥梁,挑选出照明细节和模糊区域。
627. Curb Cuts – 寻找可以让残疾人进入的路缘切割
628. Utility Pole – 盘点具有重要属性的电线杆,如架空/地下、线路数量和施工日期。
629.废物收集——确定废物收集区域,并在提供废物或转运站时寻找合适的服务轮次。(废物收集 – uDig)
630。消火栓– 将消火栓放置在市政当局中,标记其一般状况,以及为盖子上油和使用阀门的日期。
631.空间数据基础设施——连接不同部门的多个用户以管理数据、元数据、用户和工具。
632.昆虫控制– 喷洒杀虫剂以消灭蚊子和其他害虫,并知道不喷洒区域和先前喷洒的状态。
633.无家可归者收容所——分析城市不平等和无家可归者,以适当分配无家可归者收容所。
634.城市扫描– 使用移动 LiDAR 管理城市资产(道路状况、公用事业、广告牌和标志库存)以清点并确保安全标准。
635.下水道网络– 设计下水道系统及其网络,考虑通行权并使用重力流量。
636.咨询——通过在地图上绘制一个区域并连接到电话号码和自动消息警报的中央数据库来提醒市民注意沸水咨询。
637.街道清洁– 耕种城市的地理区域。
638. Speed Limits – 使用适当的标志在道路网络中定义速度限制。
639.封路– 在地图上直观地向市民提供道路封闭建议。
640.应急供水——在受到污染时准备应急供水。(军械测量 – Geomedia)
641.公墓测绘– 使用无人驾驶飞行器 UAV 实施了一个系统来绘制公墓地图,并将坟墓存储在空间数据库中。
642.开放信息——通过在地图上显示数据来减少对电话接线员的需求。
643.参与式GIS——通过公民输入和地理空间技术进行决策。
644. Land for Development – 寻找可供开发的可用服务和未服务土地。
645.地名– 为每个地方、公园、河流和感兴趣的特征命名。
646.提升站– 将水流从较低的高度移动到较高的高度,以用于下水道公用事业。
647.雨水污染– 通过估计径流和来源来测量雨水污染
648.地震斜坡稳定性– 使用地质学和数字高程模型对斜坡稳定性进行建模,以了解地震诱发的滑坡灾害的潜力。
649.水井– 制定水井的限制条件,例如质量、数量、受压含水层和饮用污染。
650.实时雪犁– 在市政网络和 GPS 中实时查看扫雪机网格。
651.固体废物——利用地理参考的垃圾收集路线自行收集。
矿业

652. Subsurface Volume Calculation – Calculating depth values to determine the volume of material between the surfaces or between a subsurface layer and the ground level with Global Mapper.
653. Quarries – Capturing volumes of fill removal and forecasting future volumes extracted to understand quarry lifespans.
654. Kriging – Using statistical approaches for mining valuation with the geostatistical technique kriging from Daniel Krige.
655. Natural Resources – Mapping out natural resources like uranium, metals, stones, and gemstones. (United States Natural Industrial Resources Map)
656. Mining Operations – Track mining assets in the field with mobile GIS.
657. Coal Exploration – Identifying new opportunities and areas for coal exploration by assessing geological data and setting out exploration targets. (Coal Exploration in GIS)
658. Mine Rehabilitation – Restoring mines back to their original state using GIS tools like 3D profiling flooding of mine because almost all working mines require pumps to remove water.
659. Hazards Assessments – Characterizing infrastructure, risk areas, and disaster zones, planning and implementating of hazards reductions measures to assist planners in selecting mitigation measures and emergency preparedness.
660. Hyperspectral Imagery – Discovering new minerals from the existing 4000 types of compositions using airborne and satellite data. (AVIRIS and AISA Hyperspectral)
661. Mineral Titles – Administering mining titles for exploration and acquisition available on a web map.
662. Diamonds – Searching for diamonds in Nairobi in fluvial diamond placer deposits.
663. Acid Runoff – Controlling acid waste runoff from mines by capturing terrain topography, mine age, and stream proximity.
Nautical

664. Anchor Search – Searching for a lost anchor in a restricted area with electrical cables and gas pipelines using sonar and bathymetry. (Anchor Search – Golden Software Surfer)
665. Open Sea Map – Sailing the big blue watery road with Open Sea Map.
666. Christopher Columbus – Tracing Christopher Columbus’ footsteps on his voyages and discovery of America.
667. Shipping Routes – Stitching together shipping routes using the Satellite-based Automatic Identification Systems.
668. International Waters – Aligning the boundaries of international waters in a georeferenced system.
669. Submarine Routes – Routing twenty thousand leagues under the sea for submarine routes using 3D modeling.
670. Live Marine Traffic – Turning your computer into a marine traffic monitoring station giving the perspective of nearby ships on the ocean. (Live Marine Traffic)
671. Trajectories and Magnitude – Using vectors (U and V) to depict nautical wind speed and direction.
672. Global Trading Ports – Climbing buoys as if you’re at giant marine trading ports – the arteries of our global economy.
673. Nautical Charts – Plotting out the seamless, collarless, and dynamic mosaic of some 2,100 NOAA raster nautical charts at varying scales. (NOAA Nautical Charts Viewer)
Ocean/Marine

674. Pacific Ocean – Opening Google Earth and realizing how the Pacific Ocean covers one side of the Earth in a global view.
675. Underwater Grasses – Diving into the ocean with satellite imagery and delineating their extents.
676. Coastal Hazards – Minimizing loss by identifying potential hazards such as algal blooms, eutrophication, and tsunamis (Coastal Hazards)
677. Ocean Use Planning – Outlining sustainable oceans through careful planning of ocean activity such as energy production, fishing, and shipping. (Planning Ocean Uses – Cindy Fowler)
678. Marine Pollution – Pinpointing the source of marine pollutants such as industrial, agricultural, and residential waste.
679. Algae Blooms – Monitoring algal blooms through multiple images over time.
680. Wave Reduction – Curtailing wave energy by mapping and building up coral reefs and other coastal habitats as a nature-based solution.
681. Deepsea Dawn Wright – Understanding the relationship and patterns of how oceans affect dry land and more. (Ocean Solutions, Earth Solutions)
682. Marine Tools Plugin – Geoprocessing with marine data to better understand research, conservation, and spatial planning problems.
683. Whale Tracker – Studying the movement and migration patterns of whales around the Hawaiian Islands. (Whale Tracker)
684. Underwater Street View – Submarining as if you’re underwater in Google Earth’s underwater street view.
685. Build-Out Design – Developing and designing a build-out project in Grenada.
686. Bathymetry – Exploring ocean bathymetry from an exaggerated 3D global perspective. (Ocean Bathymetry)
687. Rising Sea Levels – Identifying areas of risk as sea levels gradually rise from climate change.
688. Aquaculture – Farming fish in a sustainable manner by understanding where inland fisheries are located. (GISFish)
689. Coastal Management – Adapting to climate change through better flood and erosion defense.
690. Coral Reef Conservation – Understanding the present state of coral reefs through mapping to better understand future deterioration.
691. Energy Budgets – Simulating Earth’s energy budgets for anthropogenic and natural changes with anomalies of surface temperature and sea-level pressure.
692. Coastal and Marine Ecological Classification Standard (CMECS) – Combining water columns, geoform, substrate, and biotic components that are collectively used to define marine ecosystems. (CMECS)
693. Wave Heights – Replicating ocean waves by factoring size, choppiness, and wind. (Wave Heights)
694. Sea the Animals – Tracking turtles, seals, porpoises, and turtles in time-animated web maps. (CartoDB Sea the Animals)
695. Marine Bioregional Plans – Protecting the marine resources by dividing the coasts of Australia into four geographical pieces.
696. General Bathymetric Chart of the Oceans (GEBCO) – Charting out elevation paths along the ocean with GEBCO. (GEBCO)
697. Ocean Salinity – Measuring sea surface salinity from space with Aquarius. (Ocean Salinity)
698. National Marine Sanctuaries – Designating 12 areas of the marine environment as special significance to better understand marine ecosystems and their spatial, temporal, and functional relationships among creatures, environments, and human perturbations. (National Marine Sanctuaries)
699. Ocean Tourism – Getting out your towels and soaking some sun with tourist maps of the ocean.
700. Coastline Fractals – Modelling complex natural shapes along the coastline’s fractal-like (jagged recurring pattern) properties.
Oil/Gas

701. Directional Drilling – Logging depth, inclination, and azimuth (dependent on true and magnetic north) for directional drilling.
702. Active Licenses – Exploring active, operations and exploration wells at all locations on a map.
703. Oil Exploration – Planning and exploring drilling operations using 3D GIS to analyze the data and visually inspect the results.
704. Offshore Production – Mapping oil activity offshore including pipeline, significant oil and gas discoveries, and restricted zones.
705. Pipeline Rupture – Responding to pipeline ruptures to better understand surrounds and impact zones such as privately-owned parcels and critical fume areas.
706. Oil Search – Magnifying the search for resources and extending beyond the core elements (Oil Search – Boundless)
707. Pipeline Route Selection – Optimizing route selection by taking a heuristic approach and multiple layers such as the environment, geo-hazards, and engineering.
708. Geomagnetic Referencing – Using the Earth’s magnetic field obtained by the USGS to more accurately drill direction and position. (Geomagnetic Referencing)
709. Oil Reserves – Measuring how much shadow is being cast of a floating roof’s oil tanks using geometry and high spatial resolution imagery.
710. Undersea Environmental Impacts – Assessing potential impacts of the undersea environment as oil and gas activity increases.
711. Oil Reserves Map – Laying out the top 20 oil-producing countries, with reserves in billions of barrels of oil. (Manifold)
712. Environmental Impact Assessment – Gauging multiple layers including existing infrastructure, river crossings, soils and vegetation, groundwater, and elevation/ slope to determine pipeline impact.
713. gvSIG Viewport – Panning along a linear pipeline corridor in 3D with an overview viewport to know the location in public consultation.
714. Pipeline Infrastructure – Surveying footprints and inventorying pipeline infrastructures like pump stations, tank terminals, and pipelines.
715. Gulf Basin Depositional Synthesis – Providing context for exploration in the Gulf of Mexico and reducing overall risk to oil and gas companies by understanding the depositional history of drilling.
Parks

716. Trail Planning – Valuing cells to pave out a path that accumulates the least ‘cost’ from a source to a destination.
717. GPS Tracking – Applying tracking technologies to humans to understand how their movements affect ecosystems in national parks.
718. Fuzzy Logic – Identifying suitable locations for the construction of parks with relevant experts to determine the significance and weight of the criteria.
719. Biodiversity – Managing biodiversity in parks with smartphones.
720. Noise Map – Mapping sound levels in parks to show how visitors and wildlife interact with each other and park resources.
Politics/Government

721. Redistricting – Encouraging citizen involvement through web-based applications for the redistricting process (Redistricting QGIS Plugin)
722. Voting Patterns – Reviewing how electoral districts voted at the polls.
723. Bosnia-Herzegovina – Dividing a road to peace of the former Yugoslavia at the valley bottom using terrain data to support diplomatic negotiation. (Geospatial Revolution Episode 3)
724. Stewardship of Land – Supporting Native American decision-making through GIS implementation. (Tribal GIS Book – Joseph Kerski)
725. Gerrymandering – Manipulating the geographic boundaries of an electoral constituency to favor one party.
726. Open Data – Opening up government (tax-payer) data through geospatial open data portals and data sharing strategies.
727. Enabling Governments – Saving money by investing in a GIS-based system for decision making.
728. Parcel Fabric – Editing zoning, dissemination areas, and land designation boundaries.
729. Breakaway/Disputed Areas – Delineating international and maritime boundary dispute areas from Kashmir to the Elemi Triangle, Northern Cyprus to Western Sahara (Natural Earth Data)
730. Tax Evaders – Catching tax evaders by recognizing areas of wealth such as swimming pools.
731. Dissolving Political Boundaries – Grouping separated countries into one like West and East Germany as well as North and South Vietnam.
732. International Joint Commission – Solving international watershed issues through international collaboration. (Transboundary Watersheds)
733. National Geospatial Data Asset Management – Managing geospatial data as a capital asset for effective sharing, and collaboration to support efficient and effective decision-making. (FGDC National Geospatial Data Asset Management Plan)
734. Border Safety – Increasing safety at international borders often stretching miles.
Real Estate

735. Buffer Zone Search – Buffering a search area for a query when house hunting.
736. Market Analysis – Expanding businesses through customer profiling, estimating sales potential, and finding available lots.
737. Home Evaluation – Getting a big picture to understand home value including proximity to schools or panoramic view.
738. Parcel Dimensioning – Analyzing a property parcel shape to determine the area and dimensions of each identified parcel.
739. Viewshed – Prospecting viewsheds through observation points remotely when setting property prices.
740. Property Appraisals – Supporting accurate property appraisals
741. Foreclosures – Scoping out the effects of recessions on real estate markets by mapping out foreclosures by neighborhood.
742. Geocoded Real Estate – Fetching geocoded real estate in Germany through a JSON and R.
743. Housing with Mortgages – Charting out occupied houses that have a mortgage or loan. (Housing with Mortgages)
744. Wendy’s Restaurant – Prospecting optimal locations for a Wendy’s restaurant.
745. Domino’s Pizza – Streamlining the planning of Domino franchise territories.
746. Retail Site Selection – Inspecting space usage for available commercial space.
747. Comparative Real Estate Analysis – Comparing value per square meter in map form to see how much the price is for similar properties on the block. (Real Estate Comparative)
748. Wind Farm Noise – Assessing the population and number of affected buildings affected by the noise of a wind farm.
749. High Rise Valuation – Characterizing commercial real estate by its unique age, size, location, and proximity to ensure that the property values are consistent between assessed value and the sales price with Geomedia 3D visualization.
750. Construction – Considering slopes for construction and livability as 15 degrees or less is considered buildable.
751. Home Sharing – Scoping out shared homes and surroundings.
752. Real Estate Metrics – Choosing the right house to buy or build based on the distance to schools, parks, transit stops, and other geospatial metrics.
753. Google Cardboard – Visiting properties in Google Cardboard’s virtual reality experience.
754. Walkability – Understanding health factors like active transportation, bike paths, and walking paths in a neighborhood.
Reporting/News

755. Hurricane Andrew – Comparing geographically which homes fared better from Hurricane Andrew’s destruction because of changes in building code from Steve Doig’s piece that earned him a Pulitzer Prize.
756. North Korea – Mapping how far North Korea’s missile projectiles threaten other nations – previously a buffer – now corrected. (North Korea Missile Extent)
757. GeoJournalism – Assisting journalists to dive into a world of data visualization using geographic data.
758. Geotagged Tweets – Spreading the word to make world headlines from local Missouri and eventually the whole world. (CartoDB Geotagged Tweets)
759. Mapping Conflict – Putting any crisis, destruction, or terror attack on the map.
760. Google News Lab – Storytelling around the globe with Google Maps and Fusion Tables (Google News Lab)
761. Super GIS – Estimating the number of protestors at a Hong Kong rally by obtaining the average density of the crowd and estimating the number of protesters through aerial photo interpretation. (Protestor Estimate – Super GIS)
762. Highway Accidents – Reporting the location of highway accidents on a map
763. Demographics Research – Delving into census information for a deep research news story
764. Ballot Counts – Depicting the spatial Distribution of states, districts, and parties that won an election
765. The Financial Times – Utilizing tools like Mapbox to create elegant base maps with all the right details.
Society

766. Thematic Mapping – Thematic mapping of poverty with equal intervals, quantiles, natural breaks, and unique schemes. (“Making Maps Third Edition by John Krygier”)
767. Socio-Economic Data and Application Center (SEDAC) – Serving socioeconomic and Earth science data as an information gateway between the Earth and social sciences focuses on human interactions in the environment. (SEDAC)
768. World Languages – Mapping the world’s languages through social media and micro-blogging platforms. (World Languages)
769. Poverty – Sizing up poverty with the FAO GeoNetwork socio-economic indicators. (FAO GeoNetwork)
770. Hunting Zones – Tracing out hunting zones for cultures around the world.
771. Citizen Engagement – Empowering populations who have little voice in the public arena to change geographic involvement and awareness on a local level. (Ushahidi Public Participation Geographic Information Systems (PPGIS))
772. Needs of Services – Allocating the proper needs and inclusion of marginalized populations.
773. Census – Utilizing decennial TIGER data to support and improve selected demographic and economic studies.
774. World Religions – Mapping the intricate details of religions internationally.
775. Space-time GIS – Comparing scientific practice in the US and in China (Space-Time GIS – Michael F. Goodchild)
776. Center of Population – Centering in on population drift watching its shift in dasymetric mapping. (Population Drift – Joseph Kerski)
777. Earthworks – Downloading data from Stanford including labor supply, sex ratio, and social data. (Earthworks)
778. Gender Inequality – Showing the history of how women are working in the GIS field.
779. Demography – Projecting populations worldwide with a dot density style map.
780. Chart Symbology – Taking advantage of pie charts, line graphs, and bar charts to display socio-economic data by area.
781. Indigenous People – Keeping a record of traditional land use of indigenous people.
782. Public Transportation Availability – Reviewing public transit availability in societies.
783. Population Disaggregation – Estimating per-building population through disaggregation of census blocks
784. Distance Decay – Observing distance-decay between locations of ethnic groups- the further apart they are, the less likely it is that they will interact very much.
785. Refugee Camps – Capturing the movement patterns of refugees through time. (Refugee Patterns)
786. Traditional Knowledge – Preserving cultural beliefs and their associated location in a spatial database.
787. Tapestry Segmentation – Dividing U.S. residential areas into 67 distinctive segments based on their socioeconomic and demographic composition—then further classifies the segments into LifeMode and Urbanization Groups. (Tapestry Segmentation)
788. Migrant Rescue – Improving Humane operations and rescuing migrants through the deployment of emergency water stations on routes known to be used by migrants coming north through our desert. (Migrant Rescue)
789. Prism Maps – Drawing each boundary object as a raised prism, where the height of the prism is relative to the associated data value. (Golden Software Map Viewer)
790. Group Decision Making – Mediating interests and getting valued concerns in the community and society through PGIS.
791. Maori Tribe – Recording, organizing, and making available information about traditional values from Maori elders. (Maori Tribe Elders)
792. Human Mobility – Measuring human mobility using mobile phone records enhanced with GIS data.
793. Graffiti – Studying clusters of graffiti with other factors such as proximity to city constructs such as crossing guards, phone boxes, and electricity boxes.
794. Storytelling with Maps – Harnessing the power of story maps such as understanding the gap between minimum wage and high-income earners. (Income Earning in Maps)
795. Illiteracy in Myanmar – Building literacy in Myanmar and evaluating literacy programs in a GIS database with indicators such as budgeted funds, dropout levels, and available training.
796. Gender Studies – Exploring how transportation infrastructure support mobility access to basic services vital to achieving poverty reduction, gender equality, and sustainable development objectives in Ghana.
797. Child Abuse – Allocating family service facilities to sites where child abuse is more prevalent.
Soils

798. Soil Types – Modelling soil types through Jenny’s model involving climate, organisms, topography, material, and time.
799. Soil Grid – Helping agriculture decision-making with ISRIC’s 1km scale soil property and class maps of the world. (SoilsGrid)
800. Texture Classification – Digging up the dirt on soil texture through the USDA soil texture classification
801. Soil Moisture – Estimating soil moisture from space with the SMAP and SMOS satellites
802. Soil Survey Geographic Database (SSURGO) – Making sense of soil parameters like conductivity in the United States. (USDA SSURGO Database)
803. Water Retention Capacity – Determining water retention capacity for a different type of soils and topographic characteristics.
804. Erosion Reduction Strategy – Identifying erosion hot spots through topography, soil, and land-use characteristics. (Erosion and Sediment Control)
805. Slope Parameters – Developing slope profiles such as convex and concave using 3D profile graphs.
806. Soil Loss Equation – Measuring the average annual soil loss caused by rainfall and associated overland flow as defined by the United States Department of Agriculture.
807. Lead Concentration in Soils – Collecting soil samples and mapping the lead geochemical landscape. (Mapping Lead Concentrations)
808. LS Factor – Calculating slope length (LS) factor as part of the Universal Soil Loss Equation (USLE) based on slope and specific catchment area.
809. Angle of Repose – Computing the steepest angle (depending on the material) of a surface at which loose material such as soil will remain in place rather than sliding or crumbling.
810. Salinity – Inspecting salinity with electromagnetic surveys to find the electrical conductivity in soils and interpolating the results to find unknowns.
811. Peaks and Summits – Detecting peaks and summits on a landscape to help model salinity with elevation such as depression areas have a higher salinity. (Landserf)
812. Vegetation Erosion – Finding the dominant vegetation types dependent on aspect and enhancing erosion modeling using aspect and vegetation to see how slopes will erode over time along with precipitation, temperature, and growing periods.
813. Stereoscopy Tools – Creating stereo pairs from two aerial photographs with anaglyph and virtual-z mode. (PurVIEW)
814. Normalized Difference Soil Index (NDSI) – Gauging soil water content from space using shortwave infrared, near infrared wavelength, and NDSI.
Sports/Recreation

815. Strava Heat Map – Heating up the road with over 375 billion data points showing you exactly which routes other cyclists are taking. (Strava Bicycle Routes)
816. Fitbit – Plugging in your Fitbit to map your runs.
817. Tennis Analytics – Dominating your tennis opponent with in-depth spatial analytics. (Tennis Analytics)
818. Ski Hill – Creating vicious triple black diamond ski runs using the steepest path.
819. Hiking Trail – Incorporating factors in trail development like gentle slopes for an accumulated least-cost path.
820. Optimal Road Trip – Planning a road trip of the century across the United States using the shortest route for all major landmarks.
821. Golf Course Water Systems – Planning a golf course’s underground water system and sprinkler system in 3D.
822. Rollercoaster – Creating realistic a fly-through from interpolated paths using 3D animation capability in ArcGIS Pro. (Rollercoaster Animation)
823. Heli-skiing – Assessing the impacts of heli-skiing on mountain animal behavior using GPS trackers and frequently skiing areas.
824. Stadium Security – Getting the big picture by giving police and emergency responders to track activities on a web-based geospatial platform.
825. Mountaineering – Climbing steep slopes in Google Street View.
826. Surf Breaks – Sizing up wave heights from satellite radar altimeters in orbit. (GlobWave Project)
827. Marathon Routing – Planning the route of a marathon using elevation and base maps.
828. 3D Ski Maps – Touring a mountain virtually in realistic 3D virtual tours. (3D Ski Maps in Golden Software)
829. Football Stadiums – Turn maps into straight line journeys with FME’s ShortestPathFinder transformer. (Football Stadiums Journeys)
830. Google Earth Elevation Transect – Pulling out steep slopes using the elevation transect tool in Google Earth for any given cycling and jogging route.
831. Geocaching – Hunting for treasures and even surveying monuments through geocaching.
832. Swisstopo – Sculpting beautiful topography maps in 3D. (SwissTopo)
833. Fishing Maps – Creating 3D bathymetric maps in real-time with Sonar (Navionics)
834. Ride Sharing – Providing optimal and dynamic ride sharing in urban areas.
835. Mapbox Outdoors – Powering your fitness and outdoor applications with terrain maps that highlight thousands of biking, hiking, and running trails as well as ascents through topography lines.
836. Sports Stadiums – Viewing complex geometries like sports stadiums in 3D. (Vizitown QGIS 3D Plugin)
Surveying/Geodesy
837. Coordinate Calculator – Converting coordinate conversion tool of choice for GIS. (Geography Calculator – Global Mapper)
838. Fibre Optic Cable Design – Extracting LiDAR ground points to assist in fiber optic cable design at water crossings.
839. Tissot Circles – Characterizing distortion from map projections (Indicatrix Mapper QGIS Plugin)
840. Global Positioning Systems – Locating the position of anything and anywhere on Earth.
841. Ordnance Survey – Drafting out maps as one of the largest producers of maps in the World. (Ordnance Survey)
842. Equator Bulge – Measuring the bulge of Earth at the equator
843. Bearings – Importing bearings and distances from a survey for parcel mapping and transcribing it on a map.
844. Triangulation – Using trigonometry to measure the angles in a triangle formed by three survey control points
845. Shuttle Radar Topographic Mission (SRTM) – Obtaining a global digital elevation model from InSAR. (SRTM)
846. Geodetic National Adjustment – Adjusting datum positions with the Geodetic National Adjustment.
Telecommunications

847. Radio-Wave Propagation – Estimating the propagation of radio waves for a network with complex reflections and diffraction and line-of-sight.
848. Locating Cell Towers – Locating cell tower placements in urban areas using 3D building structures.
849. Network Management – Managing a network of telecommunication cables and towers in a network data set.
850. Fresnel Zones – Finding the region of space between wireless transmitter and receiver where obstructions cause interference to the signal.
851. Antenna Height Optimization – Optimizing antenna height using GIS 3D modeling.
852. Operations Support Systems (OSS) – Ensuring that network functions properly including outages, billing, and testing through GIS shared services.
853. Submarine Cable – Sketching out submarine cables that stretch across oceans. (Submarine Cable Map)
854. Network Signal Interpolation – Clustering geographically high and low network signals and interpolating results in cellular signal maps
855. Cellular Coverage Analysis – Maximizing cellular coverage using tower height by using interference analysis including viewshed and line-of-sight.
856. Frequency Management – Regulating radio spectrum to evaluate frequency interactions when approving applications using terrain, environment, and building data. (Spectrum Regulation)
857. Fibre Optic Cable – Planning fiber optic cable infrastructure through network views showing capacity, equipment, and customer demographics.
858. Market Segmentation – Segmenting customers geographically and forecasting the demand for services where growth is likely to occur.
859. Operations – Investigating interruptions in service and managing repair and maintenance work with the Autodesk Topobase infrastructure model. (LIWEST and AutoCAD 3D)
860. Signal Expansion – Planning expansion by better understanding signal strengths in three-dimensional buildings – or mapping your home Wi-Fi signal in 2D.
Tourism

861. Personality Atlas – Assigning personality stereotypes to countries around the world based on a sample size of the global population’s perspectives.
862. Tourist Map – Plotting out landmarks in tourist maps.
863. Sunrise and Sunset – Finding the perfect sunrise and sunset at any given location. (SunCalc)
864. Subway Map – Simplifying maps for the reader to better understand such as the lines of a subway map in high contrasting colors.
865. Linear Referencing – Using linear referencing along shorelines to track volumes of organic debris.
866. Off-Beaten Tracks – Finding the off-beaten track for backpackers and marking its position with 3 words.
867. Safe Travel – Advising travelers where unsafe locations are on a map.
868. Tourism Dollars – Tracking the exports of purchased goods and services using desire lines.
869. Sustainable Tourism Planning – Identifying conflicting interests in tourism and solving issues by examining suitable locations for proposed developments.
870. Hotel Search – Searching geographically for five-star hotels using a circle radius.
871. Horizon Blockage – Calculating the horizon blocking line in all directions from a given observation point with gvSIG’s Horizon Blockage.
872. Travel Mode Detection – Detecting travel mode (walk, car, bus, subway, and commuter rail) from a multi-modal transportation network using GIS and GPS in New York City.
873. Finding Islands – Using satellites to find uninhabited islands around the world – Landsat found Landsat Island near the coast of Canada.
874. Time Zones – Representing time zones around the world.
875. Eco-Tourism Site Selection – Gauging environmental impacts for sustainable eco-tourism sites.
876. Virtual Travel – Seeing your destination before physically being there. (Google Earth Street View)
877. Geo-tagging – Discover places with 360 panoramic camera views. (Mapillary)
878. Highway Planning – Constructing viewpoints with multiple layers like ecology, topography, and cultural features for a three-dimensional visual highway.
879. Virtual Arctic – Exploring the Arctic in Google Street View without getting out of your chair.
880. 3D Synthetic Scene – Overlaying synthetic scenes over the real scene. (Manifold)
881. Life Travels – Accompanying travelers in their life travels in map-form. (Where in the World is Andrew?)
882. Yellowstone – Putting all the pieces together in a GIS database at Yellowstone National Park including its geologic past, geyser recharge, and seismic activity.
883. Trip Planning – Adventuring around for your next road trip with pit stops and offbeat using suggested sites.
884. Observer Points – Calculating visibility through multiple observer points.
885. Historic Street View – Time-travelling in the past to see just how much a location has changed over time with a historic street view.
Transmission

886. Corridor Analyst – Identifying possible corridors and preferred transmission routes using Least Cost Path engineering, environment, and combined routing algorithms.
887. Transmission Line Monitoring – Monitoring overhead transmission towers with active and passive satellite data.
888. Viewshed – Understanding the impacts of how a transmission line would look using viewsheds.
889. Right-of-way – Buffering proposed transmission lines which will be areas cleared for the transmission line.
890. Transmission Line Design – Considering slope, soils, and land use for factoring into transmission line design.
891. Tree Encroachment – Reducing the risk of falling trees with LiDAR in search of dead and dying trees near utility lines.
892. Public Consultation – Visualizing the transmission line with towers in public using 2D and 3D environments.
893. Line Vision – Synchronizing 2D viewing in 3D environments with viewports. (gvSIG 3D Plugin)
894. 3D Geometry – Sketching up custom 3D transmission towers and lines for import into ArcScene. (Google SketchUp and COLLADA)
895. Line Profile – Utilizing slope profiles to generate terrain profiles with Manifold GIS.
896. Environmental Monitoring – Referencing environmentally sensitive sites along a linear transmission system.
897. Map Automation – Generating maps automatically from tiles along a transmission corridor with ArcGIS Data Driven Pages or QGIS Atlas.
Transportation

898. Travelling Salesman – Constructing efficient journeys that visit any number of points on a network in no particular order. (Travelling Salesman)
899. Hadoop – Leveraging the Hadoop framework for millions of data points with big data spatial analytics. (Hadoop Framework)
900. Deadliest Roads – Pinpointing the safest and deadliest roads on the planet with the Roads Kills Map. Spoiler: the Dominican Republic has the most dangerous roads. (Roads Kill Map)
901. Multimodal – Getting cars off the road for multi-modal options by studying cycling paths and walkability.
902. Turn Restrictions – Adding restrictions to U-turns in a network dataset. (TNT Network Analysis)
903. Parking Demand – Estimating parking demand and its fit with parking capacity with Python. (PARKFIT)
904. A/B Testing – Making real-world choices by sending cars to various routes for the fastest deliveries. (Spatial A/B Testing)
905. Closest Facility – Solving the cost of traveling between incidents and facilities which are nearest to one another.
906. Infrastructure Damage – Reporting damaged infrastructure in a browser web mapping system.
907. Motor Vehicle Collisions – Correlating motor vehicle collisions with spatial attributes such as speed limits, guardrails, and on-street parking.
908. Intersection Analysis – Improving intersection safety through crash and road safety analysis with the MapWindow Safety Software Plugin.
909. Intelligent Transportation System (ITS) – Feeding data from GPS units, video cameras, and road monitoring units to advance the efficiency and safety of transportation systems.
910. Shortest Path – Generating the shortest, fastest, or least-costly route between any number of origins and any number of destinations, with any number of intermediate points. (Shortest Path)
911. Vessel Tracking – Plotting automatic identification system (AIS) points on a map in real-time.
912. Network Travel Costs – Determining travel costs from each origin to all destinations
913. Road Asset Management – Using ground survey data showing assets on a roadway in Manifold GIS.
914. UPS Parcel Delivery – Seeing every driver in near-real-time to study the safety and find shorter routes – saving time, tire tread, and costs.
915. Floating Car Systems – Displaying taxi fleet in one hour.
916. Logistics Management – Planning, implementing, and controlling the efficient effective flow and storage of goods and services from a point of origin to point of consumption.
917. Street Repair – Inventorying and reporting repairs on streets.
918. Road Assessment – Taking measurements of pavement through aerial and mobile LiDAR.
919. Trip Generation/Production – Estimating the number of trips that are produced or originate in each zone of a study area. (TransCAD Trip Generation and Production)
920. Railways – Tying railways together with CartoDB’s railway map – from cargo to passenger trains. (Railroads – A Staple for Growth)
921. Service Areas – Identifying service areas from a fixed point along a network route to show response coverage for emergency vehicles.
922. OD Cost Matrix – Improving coordination amongst transportation providers when given multiple origins and multiple destinations.
923. Paratransit – Accessing rides through address entry and buffering points to find nearest routes.
924. World Traffic – Helping drivers get to destinations efficiently with traffic conditions around the world. (World Traffic Map)
925. Transportation Master Plan – Planning future highways and roads by looking at the growth of communities and traffic demand.
926. Airline Planning – Navigating to safer airspace by including nearby land use to runway lighting systems.
927. Routing Workers – Optimizing routes by seeing overlap which saves fuel costs.
928. Traffic Ways – Seeing the world as only traffic ways. (Traffic Ways)
929. Carpooling – Adding carpool lots by analyzing the number of incoming trips in a city.
930. Bus Route – Designing transit routes with cost and demographic impacts. (TransMix Transit Planning)
931. Active Transportation Planning – Leveraging the public with Participatory Geographic Information Systems and active transportation
932. Conflation – Conflating two road datasets with OpenJump Vivid extension “Road Mapper” or Spatial Adjustment in ArcGIS.
933. Infrastructure Life Cycle – Reiterating the process of planning, designing, constructing, operating, and maintaining a transportation system.
934. Inter-modal Transportation – Compiling two different modes of transportation (such as rail and truck) to move goods or passengers.
935. Rails-to-Trails Conservancy – Converting unused railways into paved multi-use paths. (Rails-to-Trails)
936. Traffic Congestion – Alleviating traffic congestion by making the best possible use of the existing transportation network and gathering data to improve decisions for modifying the network.
937. Sidewalk Inventory – Storing sidewalk data in a database with attributes like width, surface type, and clearing priority.
938. Transit Ridership – Collecting statistics on how many passengers ride transit in a given neighborhood.
939. National Bridge Inventory – Making a repository of bridges in a national-wide database.
940. UPS Telematics – Monitor performance and safety of package cars Safety including seatbelt usage, speed, and whether or not a door was shut.
941. Urban Traffic Air Pollution – Recording urban traffic air pollution and quality through 3D visualization in planar and non-planar views.
942. Multi-Criteria Decision Analysis – Selecting highway routes using multiple criteria. (Multi-criteria Decision Analysis QGIS Plugin)
943. Walkability – Mapping out hot spots and cold spots with walkability and kernel density.
944. Bike Sharing – Optimizing locations of bike-sharing program stations.
Utilities

945. Billing Systems – Updating and correcting the billing system for the cost of street and security lighting. (Spatial Billing Systems)
946. Network Management – Visualizing complex spatial webs of utility networks as the foundation to manage the lifecycle of network assets for utilities. (GE Smallworld)
947. Emergency Repairs – Flagging potential emergencies with weather forecasts, staging support where needed, and logistics for the movement of people.
948. Underground Utilities – Penetrating the ground with radar for precise locations of underground gas, water, electrical, and telephone utilities.
949. Pole Inventory – Pinning down with GPS accuracy utility poles.
950. Power Distribution – Figuring out which distribution line could take down an entire network.
951. Vegetation Encroachment – Overlaying LiDAR data with transmission to see where and how much vegetation is encroaching
952. Subsurface 3D Utility Model – Viewing underground utilities in 3D.
953. Lifecycle Management – Updating life cycle status of utility information as existing or proposed in GE SmallWorld
954. Permafrost – Assessing the impacts of permafrost freezing and thawing on utility lines.
955. Utility Pole Replacement – Obtaining all the information when replacing utility poles and other business operations (Asset ID, construction date, overhead/underground conductor, and conductors it supports with the number of wire and cable segments
956. Power Outages – Helping customers keep the lights on with assets and attributes such as poles and transformers in AutoCAD Map 3D.
957. Cost Path – Laying out a gas pipeline from one location to another location with a CAD schematic in AutoCAD 3D.
958. Energy Usage – Mapping trends of electricity usage that are metered to a network.
959. Smart Grids – Determining optimal locations for smart grid and real-time analytic components.
960. Infrastructure Design – Planning network infrastructure, build, operations, and maintenance with Smallworld Core.
961. Energy Demand Estimation – Combining building volume, number of floors and other characteristics to predict the energy demand for heating and cooling using 3D city models in Germany. (Energy Demand Estimates)
962. Schematics – Representing a complex utility network in a simple schematics diagram with ArcGIS Schematics.
963. Street View Measure – Examining utility operations in street view and measuring distances (MM Plugin in ArcGIS)
964. Line Extension Easements – Creating electrical line extension easements (legal rights of access) in GE SmallWorld Electric Office Geospatial Asset Management
965. Cloud Computing – Building and sharing maps in the cloud for common operating and faster decision-making.
Volunteer

966. GIS Corps – Volunteering in GIS projects such as bridging the divide between the world’s insurance markets and the most vulnerable, low-income people. (GIS Corps)
967. National Geographic Society – Preserving and protecting our planet as a global non-profit organization funding hundreds of projects each year. (National Geographic Society)
968. Urban and Regional Information Systems Association (URISA) – Solving challenges in local and national governments through GIS and other information technologies. (URISA)
969. Wikimapia – Describing the world in online, editable maps and mashups with free data available for you to experiment with and create unique applications. (Wikimapia)
970. OpenStreetMap – Establishing open information as a free, editable map through volunteered input.
971. Open Geospatial Consortium – Making quality open standards for the global geospatial community. (Open Geospatial Consortium)
972. USGS Earth Explorer – Opening up satellite data to the world for free. (USGS Earth Explorer)
973. NASA World Wind – Monitoring weather patterns, visualizing cities and terrain, tracking the movement of planes, vehicles, and ships, analyzing geospatial data, and educating people about the Earth with the cross-platform, Java-based NASA World Wind. (NASA World Wind)
974. Open Source Geospatial Foundation (OSGeo) – Supporting the collaborative development of open source geospatial software, and promoting its widespread use. (OSGeo)
975. ArcGIS Open Data – Exploring tens of thousands of data sets around the world from thousands of organizations around the world. (ArcGIS Open Data)
976. Real-Time Collaboration – Collaborating in OpenStreetMap with multiple user entries. (Real-time Collaboration)
977. Natural Earth – Producing public domain data with beautiful cartography layers.
978. Volunteered Geographic Information (VGI) – Harnessing tools to create, assemble, and disseminate geographic data provided voluntarily by individuals (Citizens as Sensors – Goodchild, 2007)
979. QGIS – Pioneering the #1 option for open GIS software. (QGIS Founder – Gary Sherman)
Weather

980. Real-time Lightning – 在地图上捕捉实时雷击,监测站位于世界各地。(实时闪电)
981. Global Wind Vectors – 以矢量为方向显示阵风。(全球风 – 零学校)
982.反照率– 使用表面反射卫星数据测量地球热预算的反照率 – 明亮区域比黑暗区域反射更多。
983.太阳辐照度——利用全球水平太阳辐照度利用太阳能。(全球水平辐照度)
984 .夜间边界– 用夜间边界图说明地球上哪些地方的人正在熟睡和清醒。(夜间边界)
985.降雨——在 NOAA 的国家气象局网络地图中说明降雨。
986. NASA Ocean Color – 下载叶绿素-a 浓度和海面温度数据集,用于研究海洋酸化和缺氧日益增加的风险。(NASA Ocean Color)
987.历史天气– 通过研究旧天气来辨别天气模式。(旧天气)
988.温度– 使用多维 NetCDF 绘制温度,其中包括纬度、经度、高度和时间的维度。( NASA 温度 NetCDF)
989.降雪– 知道有多少降雪发生在哪里。
990.方位角– 计算每个位置的太阳高度、太阳方位角和天空中的太阳时数(R.Sun – GRASS GIS)
991.天气异常– 跟踪空间数据库中的天气事件,例如阿尔及利亚南部撒哈拉沙漠中的雪.
992. 3D Snow Depths – 使用 Golden Software 绘制滑雪胜地的 3D 雪深。(雪深图)
993.太平洋 Blob – 绘制“The Blob”的范围 – 海面温度远高于正常水平的异常物体。
994. 3D 大气数据– 可视化大气特征层,如垂直剖面。
995. Ocean Surface Current Analysis Real-time (OSCAR) – 提供近乎实时的全球洋面洋流。(OSCAR 数据)
996.天气警告——通过国家气象局的物理位置提供实时警告。(天气警告)
997.历史降水– 使用 MapWindow Meteobase 从 NetCDF 中的地面站和雷达观测历史降水。
998. Cirrus Clouds – 使用 Landsat 的 Cirrus 波段检测卷云。
999. Hovmoller 图– 以经纬度为轴绘制气象数据。(Hovmoller Diagrams – ILWIS )
1000. Doppler Radar – 使用 Doppler Radar 预测降雨。
1001. Sky View Factor – 考虑可见天空和地形影响来估计辐射平衡、温度和蒸散。
1002.气象站——获取世界各地气象站的经纬度位置。